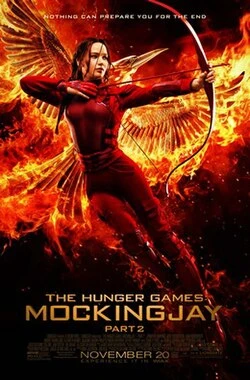
Synopsis
Katniss and a team of rebels from District 13 prepare for the final battle that will decide the fate of Panem.
Scores
Overall Score
91.9
Popularity Percentile (Year)
97.5%
Box Office Percentile (Year)
98.8%
Review Aggregate
67.6
Critic Consensus
No professional critic quote data was available to synthesize a consensus summary.
No tags
Cast
| Cast | Year | Reported Salary | Inflation Adjusted | Notes |
|---|---|---|---|---|
| Jennifer Lawrence | 2015 | $20,000,000 source | $26,472,572 | reported |
| Josh Hutcherson | 2015 | $5,000,000 source | $6,618,143 | reported |
| Liam Hemsworth | 2015 | $5,602,000 | $7,415,000 | (est) |
| Woody Harrelson | 2015 | $4,580,000 | $6,063,000 | (est) |
| Elizabeth Banks | 2015 | $3,918,000 | $5,186,000 | (est) |
| Julianne Moore | 2015 | $3,448,000 | $4,564,000 | (est) |
| Philip Seymour Hoffman | 2015 | $3,096,000 | $4,098,000 | (est) |
| Jeffrey Wright | 2015 | $2,819,000 | $3,732,000 | (est) |
| Stanley Tucci | 2015 | $2,596,000 | $3,437,000 | (est) |
| Donald Sutherland | 2015 | $2,412,000 | $3,192,000 | (est) |
Aggregated Reviews
Rotten Tomatoes critic score70.0
RT critic review count292
Rotten Tomatoes audience score66.0
RT audience rating count100,000
IMDb rating6.6
IMDb votes400,600
Box Office ?
| Category | Year | Reported | Inflation Adjusted |
|---|---|---|---|
| Domestic | 2015 | $281,723,900 | $372,897,817 |
| International | 2015 | $371,704,350 | $491,998,516 |
| Worldwide | 2015 | $653,428,300 | $864,896,400 |
Earnings / Profitability
| Category | Year | Reported | Inflation Adjusted |
|---|---|---|---|
| Revenues | |||
| Theatrical Net Revenue | 2015 | $289,543,690 | $383,248,315 |
| Digital Rentals ? | 2015 | $4,685,000 | $6,201,200 |
| Digital Purchases ? | 2015 | $4,913,000 | $6,502,987 |
| Physical Rentals ? | 2015 | $5,315,000 | $7,035,086 |
| Physical Purchases ? | 2015 | $14,243,000 | $18,852,442 |
| TV & Streaming Revenue | 2015 | $78,882,692 | $104,411,389 |
| Total Revenues | 2015 | $397,582,382 | $526,251,420 |
| Expenses | |||
| Budget ? | 2015 | $160,000,000 | $211,780,579 |
| Print & Advertising (P&A) ? | 2015 | $112,781,000 (est) | $149,280,160 (est) |
| Participations | 2015 | $59,637,000 | $78,937,240 |
| Residuals ? | 2015 | $5,520,000 | $7,306,430 |
| Interest & Overhead | 2015 | $19,200,000 | $25,413,670 |
| Total Expenses | 2015 | $357,138,000 | $472,718,079 |
| Movie Net Profit or Loss | 2015 | $40,444,382 | $53,533,342 |
Similar Movies
| Poster | Movie | Year | Match | Overall | Est. Profit |
|---|---|---|---|---|---|
 | The Hunger Games: Catching Fire | 2013 | Shared franchise (1) | 96.5 | $202,595,306 |
 | The Hunger Games | 2012 | Shared franchise (1) | 95.2 | $280,357,707 |
 | The Hunger Games: Mockingjay - Part 1 | 2014 | Shared franchise (1) | 92.4 | $74,965,822 |
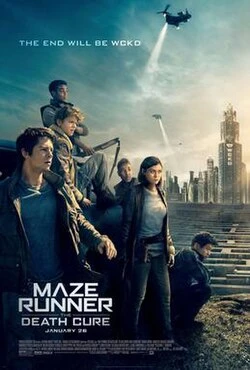 | Maze Runner: The Death Cure | 2018 | Shared genres: 10 | 86.7 | $26,991,493 |
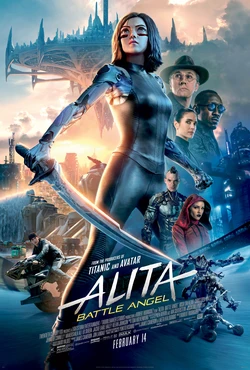 | Alita: Battle Angel | 2019 | Shared genres: 9 | 92.7 | $-48,557,406 |