Synopsis
A look at the relationship between Mike Wazowski and James P. "Sully" Sullivan during their days at Monsters University, when they weren't necessarily the best of friends.
Scores
Overall Score
93.9
Popularity Percentile (Year)
96.8%
Box Office Percentile (Year)
99.0%
Review Aggregate
78.3
Critic Consensus
Critic reception is largely positive, with 80% of 199 logged reviews marked Fresh. Across reviews, critics repeatedly emphasize funny, family-friendly, emotional. Most critics frame the film as an effective delivery of its core style and intent.
funnyfamily-friendlyemotionallightheartedvisually strikinggrittyrealisticcoming of agehistoricalcharacter-driven
Cast
| Cast | Year | Reported Salary | Inflation Adjusted | Notes |
|---|---|---|---|---|
| Billy Crystal | 2013 | $17,627,000 | $23,733,000 | (est) |
| John Goodman | 2013 | $10,851,000 | $14,609,000 | (est) |
| Steve Buscemi | 2013 | $8,170,000 | $10,999,000 | (est) |
| Helen Mirren | 2013 | $6,680,000 | $8,993,000 | (est) |
| Peter Sohn | 2013 | $5,714,000 | $7,693,000 | (est) |
| Joel Murray | 2013 | $5,029,000 | $6,771,000 | (est) |
| Sean Hayes | 2013 | $4,515,000 | $6,078,000 | (est) |
| Dave Foley | 2013 | $4,112,000 | $5,536,000 | (est) |
| Charlie Day | 2013 | $3,786,000 | $5,098,000 | (est) |
| Nathan Fillion | 2013 | $3,517,000 | $4,735,000 | (est) |
Aggregated Reviews
Rotten Tomatoes critic score80.0
RT critic review count200
Rotten Tomatoes audience score81.0
RT audience rating count250,000
IMDb rating7.2
IMDb votes414,198
Box Office ?
| Category | Year | Reported | Inflation Adjusted |
|---|---|---|---|
| Domestic | 2013 | $268,492,770 | $361,485,758 |
| International | 2013 | $475,066,850 | $639,607,169 |
| Worldwide | 2013 | $743,559,600 | $1,001,092,900 |
Earnings / Profitability
| Category | Year | Reported | Inflation Adjusted |
|---|---|---|---|
| Revenues | |||
| Theatrical Net Revenue | 2013 | $324,273,125 | $436,585,747 |
| Digital Rentals ? | 2013 | $5,578,000 | $7,509,951 |
| Digital Purchases ? | 2013 | $3,335,000 | $4,490,084 |
| Physical Rentals ? | 2013 | $7,210,000 | $9,707,197 |
| Physical Purchases ? | 2013 | $18,681,000 | $25,151,200 |
| TV & Streaming Revenue | 2013 | $75,177,976 | $101,216,012 |
| Total Revenues | 2013 | $434,255,101 | $584,660,191 |
| Expenses | |||
| Budget ? | 2013 | $200,000,000 | $269,270,385 |
| Print & Advertising (P&A) ? | 2013 | $130,348,000 (est) | $175,494,281 (est) |
| Participations | 2013 | $34,740,000 | $46,772,266 |
| Residuals ? | 2013 | $5,831,000 | $7,850,578 |
| Interest & Overhead | 2013 | $24,000,000 | $32,312,446 |
| Total Expenses | 2013 | $394,919,000 | $531,699,956 |
| Movie Net Profit or Loss | 2013 | $39,336,101 | $52,960,235 |
Similar Movies
| Poster | Movie | Year | Match | Overall | Est. Profit |
|---|---|---|---|---|---|
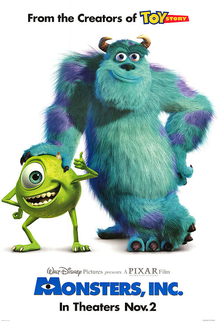 | Monsters, Inc. | 2001 | Shared franchise (1) | 97.4 | $142,461,262 |
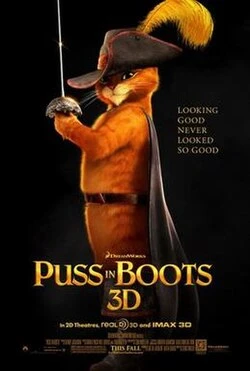 | Puss in Boots | 2011 | Shared genres: 8 | 90.0 | $14,722,990 |
 | Toy Story 3 | 2010 | Shared genres: 7 | 98.0 | $216,158,051 |
 | Toy Story | 1995 | Shared genres: 7 | 97.9 | $171,576,210 |
 | Inside Out | 2015 | Shared genres: 7 | 97.4 | $115,137,525 |