Synopsis
Two young friends find a magic book that brings a ventriloquist's dummy to life.
Scores
Overall Score
75.6
Popularity Percentile (Year)
76.2%
Box Office Percentile (Year)
91.6%
Review Aggregate
46.1
Critic Consensus
Critic reception is mixed, with 48% of 93 logged reviews marked Fresh. Across reviews, critics repeatedly emphasize family-friendly, scary, thin plot. Common reservations focus on thin plot, even when reviewers praise standout elements.
family-friendlyscarythin plotfunnymacabrecoming of ageemotionalcharacter-drivengritty
Cast
| Cast | Year | Reported Salary | Inflation Adjusted | Notes |
|---|---|---|---|---|
| Wendi McLendon-Covey | 2018 | $2,282,000 | $2,851,000 | (est) |
| Madison Iseman | 2018 | $1,405,000 | $1,755,000 | (est) |
| Jeremy Ray Taylor | 2018 | $1,058,000 | $1,321,000 | (est) |
| Caleel Harris | 2018 | $865,000 | $1,080,000 | (est) |
| Chris Parnell | 2018 | $740,000 | $924,000 | (est) |
| Ken Jeong | 2018 | $651,000 | $813,000 | (est) |
Aggregated Reviews
Rotten Tomatoes critic score48.0
RT critic review count93
Rotten Tomatoes audience score37.0
RT audience rating count1,000
IMDb rating5.6
IMDb votes25,409
Box Office ?
| Category | Year | Reported | Inflation Adjusted |
|---|---|---|---|
| Domestic | 2018 | $46,700,632 | $58,343,242 |
| International | 2018 | $46,619,748 | $58,242,193 |
| Worldwide | 2018 | $93,320,384 | $116,585,440 |
Earnings / Profitability
| Category | Year | Reported | Inflation Adjusted |
|---|---|---|---|
| Revenues | |||
| Theatrical Net Revenue | 2018 | $41,998,215 | $52,468,498 |
| Digital Rentals ? | 2018 | $3,871,000 | $4,836,052 |
| Digital Purchases ? | 2018 | $4,667,000 | $5,830,497 |
| Physical Rentals ? | 2018 | $2,384,000 | $2,978,338 |
| Physical Purchases ? | 2018 | $6,764,000 | $8,450,286 |
| TV & Streaming Revenue | 2018 | $11,675,158 | $14,585,810 |
| Total Revenues | 2018 | $71,359,373 | $89,149,482 |
| Expenses | |||
| Budget ? | 2018 | $35,000,000 | $43,725,607 |
| Print & Advertising (P&A) ? | 2018 | $33,487,000 (est) | $41,835,411 (est) |
| Participations | 2018 | $1,427,000 | $1,782,755 |
| Residuals ? | 2018 | $1,481,000 | $1,850,218 |
| Interest & Overhead | 2018 | $5,950,000 | $7,433,353 |
| Total Expenses | 2018 | $77,345,000 | $96,627,344 |
| Movie Net Profit or Loss | 2018 | $-5,985,627 | $-7,477,862 |
Similar Movies
| Poster | Movie | Year | Match | Overall | Est. Profit |
|---|---|---|---|---|---|
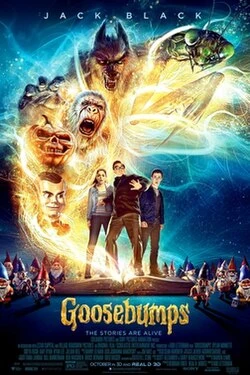 | Goosebumps | 2015 | Shared franchise (1) | 86.4 | $-26,033,488 |
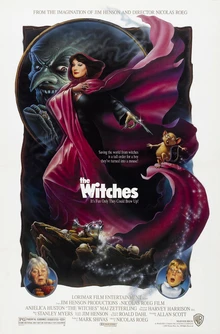 | The Witches | 1990 | Shared genres: 7 | 72.3 | $24,063,809 |
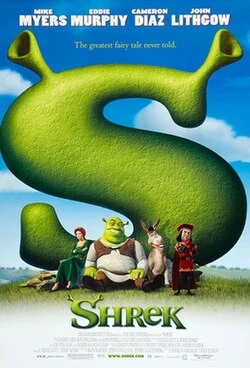 | Shrek | 2001 | Shared genres: 6 | 95.9 | $196,186,888 |
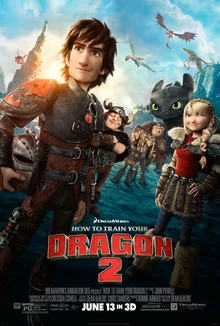 | How to Train Your Dragon 2 | 2014 | Shared genres: 6 | 95.1 | $48,707,125 |
 | Charlie and the Chocolate Factory | 2005 | Shared genres: 6 | 92.5 | $53,833,955 |