Synopsis
After his auto-parts tycoon father dies, the overweight, underachieving son teams up with a snide accountant to try and save the family business.
Scores
Overall Score
82.0
Popularity Percentile (Year)
91.6%
Box Office Percentile (Year)
79.0%
Review Aggregate
65.7
Critic Consensus
Critic reception is mixed, with 41% of 37 logged reviews marked Fresh. Across reviews, critics repeatedly emphasize funny, family-friendly, character-driven. Common reservations focus on execution consistency, even when reviewers praise standout elements.
funnyfamily-friendlycharacter-drivenemotionalvisually strikingthought-provoking
Cast
| Cast | Year | Reported Salary | Inflation Adjusted | Notes |
|---|---|---|---|---|
| Chris Farley | 1995 | $2,000,000 source | $4,116,798 | reported |
| David Spade | 1995 | $1,002,000 | $2,062,000 | (est) |
| Bo Derek | 1995 | $754,000 | $1,552,000 | (est) |
| Brian Dennehy | 1995 | $617,000 | $1,269,000 | (est) |
Aggregated Reviews
Rotten Tomatoes critic score41.0
RT critic review count49
Rotten Tomatoes audience score90.0
RT audience rating count250,000
IMDb rating7.1
IMDb votes102,828
Box Office ?
| Category | Year | Reported | Inflation Adjusted |
|---|---|---|---|
| Domestic | 1995 | $32,679,900 | $67,268,270 |
| International | 1995 | N/A | N/A |
| Worldwide | 1995 | $32,679,900 | $67,268,270 |
Earnings / Profitability
| Category | Year | Reported | Inflation Adjusted |
|---|---|---|---|
| Revenues | |||
| Theatrical Net Revenue | 1995 | $16,339,950 | $33,634,135 |
| Digital Rentals ? | 1995 | N/A | N/A |
| Digital Purchases ? | 1995 | N/A | N/A |
| Physical Rentals ? | 1995 | $38,854,000 | $79,977,031 |
| Physical Purchases ? | 1995 | $40,031,000 | $82,399,766 |
| TV & Streaming Revenue | 1995 | $8,169,975 | $16,817,068 |
| Total Revenues | 1995 | $103,394,925 | $212,827,999 |
| Expenses | |||
| Budget ? | 1995 | $20,000,000 | $41,167,978 |
| Print & Advertising (P&A) ? | 1995 | $8,220,000 (est) | $16,920,039 (est) |
| Participations | 1995 | $8,272,000 | $17,027,076 |
| Residuals ? | 1995 | $6,221,000 | $12,805,300 |
| Interest & Overhead | 1995 | $4,000,000 | $8,233,596 |
| Total Expenses | 1995 | $46,713,000 | $96,153,988 |
| Movie Net Profit or Loss | 1995 | $56,681,925 | $116,674,012 |
Similar Movies
| Poster | Movie | Year | Match | Overall | Est. Profit |
|---|---|---|---|---|---|
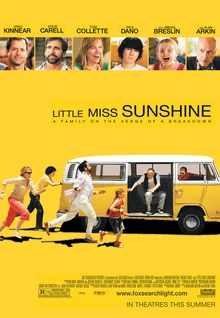 | Little Miss Sunshine | 2006 | Shared genres: 3 | 93.4 | $85,889,464 |
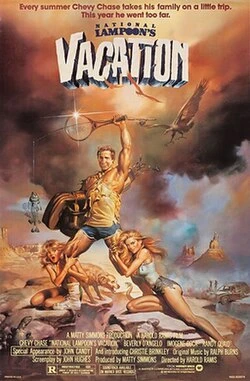 | National Lampoon's Vacation | 1983 | Shared genres: 3 | 91.7 | $36,147,651 |
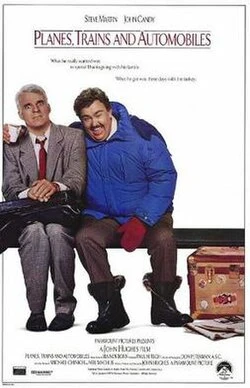 | Planes, Trains & Automobiles | 1987 | Shared genres: 3 | 90.4 | $46,239,710 |
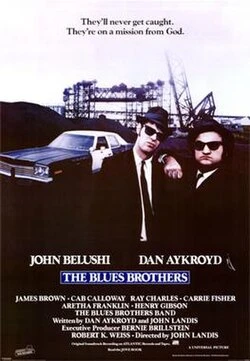 | The Blues Brothers | 1980 | Shared genres: 3 | 89.7 | $5,851,589 |
 | We're the Millers | 2013 | Shared genres: 3 | 89.6 | $78,297,406 |