Synopsis
Garden gnomes, Gnomeo and Juliet recruit renowned detective Sherlock Gnomes to investigate the mysterious disappearance of other garden ornaments.
Scores
Overall Score
70.6
Popularity Percentile (Year)
69.3%
Box Office Percentile (Year)
91.3%
Review Aggregate
37.0
Critic Consensus
Critic reception is mixed, with 28% of 65 logged reviews marked Fresh. Across reviews, critics repeatedly emphasize family-friendly, thin plot, funny. Common reservations focus on thin plot, even when reviewers praise standout elements.
family-friendlythin plotfunnylightheartedmacabresuspensefulemotionalvisually strikingupliftingchristmas
Cast
| Cast | Year | Reported Salary | Inflation Adjusted | Notes |
|---|---|---|---|---|
| James McAvoy | 2018 | $3,268,000 | $4,082,000 | (est) |
| Emily Blunt | 2018 | $2,011,000 | $2,513,000 | (est) |
| Chiwetel Ejiofor | 2018 | $1,514,000 | $1,892,000 | (est) |
| Maggie Smith | 2018 | $1,238,000 | $1,547,000 | (est) |
| Michael Caine | 2018 | $1,059,000 | $1,323,000 | (est) |
| Ashley Jensen | 2018 | $932,000 | $1,165,000 | (est) |
| Matt Lucas | 2018 | $837,000 | $1,046,000 | (est) |
| Stephen Merchant | 2018 | $762,000 | $952,000 | (est) |
| Ozzy Osbourne | 2018 | $702,000 | $877,000 | (est) |
| Mary J. Blige | 2018 | $652,000 | $815,000 | (est) |
| Jamie Demetriou | 2018 | $610,000 | $762,000 | (est) |
| Johnny Depp | 2018 | $574,000 | $717,000 | (est) |
Aggregated Reviews
Rotten Tomatoes critic score28.0
RT critic review count65
Rotten Tomatoes audience score36.0
RT audience rating count1,000
IMDb rating5.3
IMDb votes15,126
Box Office ?
| Category | Year | Reported | Inflation Adjusted |
|---|---|---|---|
| Domestic | 2018 | $43,242,871 | $54,023,451 |
| International | 2018 | $47,254,907 | $59,035,700 |
| Worldwide | 2018 | $90,497,778 | $113,059,152 |
Earnings / Profitability
| Category | Year | Reported | Inflation Adjusted |
|---|---|---|---|
| Revenues | |||
| Theatrical Net Revenue | 2018 | $40,523,398 | $50,626,006 |
| Digital Rentals ? | 2018 | $3,737,000 | $4,668,646 |
| Digital Purchases ? | 2018 | $4,505,000 | $5,628,110 |
| Physical Rentals ? | 2018 | $2,302,000 | $2,875,896 |
| Physical Purchases ? | 2018 | $6,529,000 | $8,156,700 |
| TV & Streaming Revenue | 2018 | $10,810,718 | $13,505,863 |
| Total Revenues | 2018 | $68,407,116 | $85,461,220 |
| Expenses | |||
| Budget ? | 2018 | $59,000,000 | $73,708,881 |
| Print & Advertising (P&A) ? | 2018 | $41,570,000 (est) | $51,933,528 (est) |
| Participations | 2018 | $1,368,000 | $1,709,047 |
| Residuals ? | 2018 | $1,408,000 | $1,759,019 |
| Interest & Overhead | 2018 | $8,850,000 | $11,056,332 |
| Total Expenses | 2018 | $112,196,000 | $140,166,807 |
| Movie Net Profit or Loss | 2018 | $-43,788,884 | $-54,705,587 |
Similar Movies
| Poster | Movie | Year | Match | Overall | Est. Profit |
|---|---|---|---|---|---|
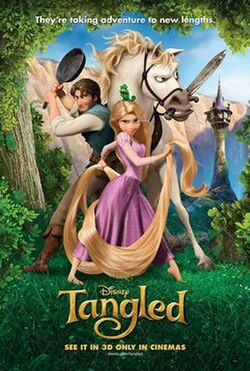 | Tangled | 2010 | Shared genres: 8 | 95.4 | $-31,230,690 |
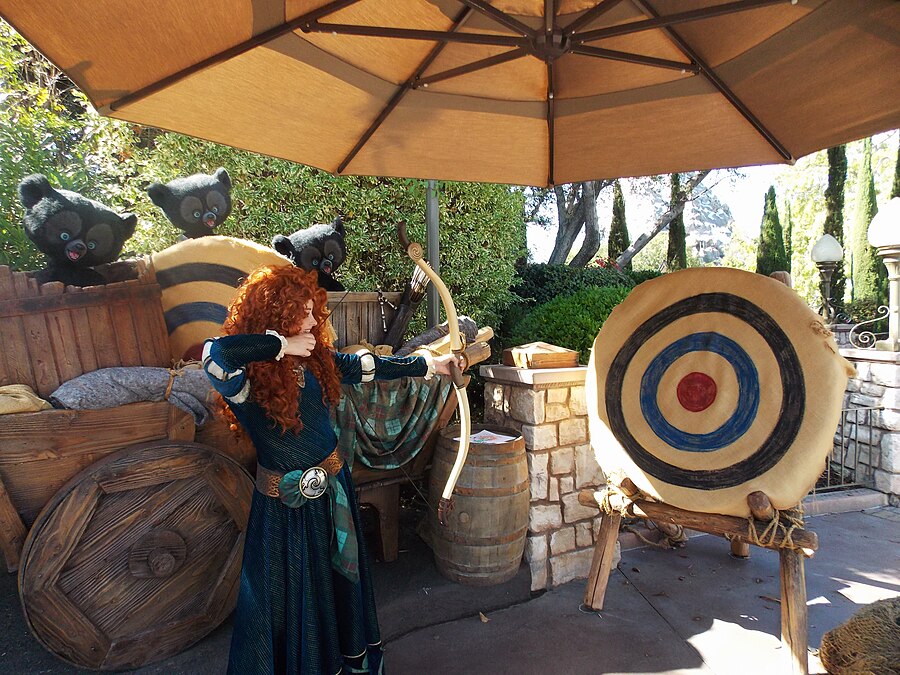 | Brave | 2012 | Shared genres: 8 | 93.2 | $-7,895,099 |
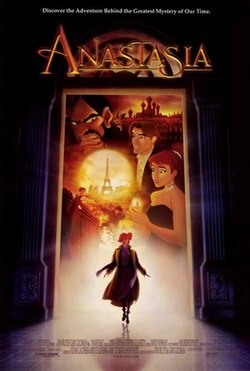 | Anastasia | 1997 | Shared genres: 8 | 86.9 | $2,395,760 |
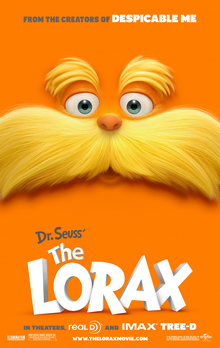 | The Lorax | 2012 | Shared genres: 8 | 85.0 | $65,206,135 |
 | The Book of Life | 2014 | Shared genres: 8 | 84.7 | $-8,653,538 |