Synopsis
An isolated community of superhumans fight to protect themselves.
Scores
Overall Score
41.1
Popularity Percentile (Year)
21.7%
Box Office Percentile (Year)
59.9%
Review Aggregate
52.0
Critic Consensus
No professional critic quote data was available to synthesize a consensus summary.
No tags
Cast
| Cast | Year | Reported Salary | Inflation Adjusted | Notes |
|---|---|---|---|---|
| Anson Mount | 2017 | $30,000 | $39,000 | (est) |
| Serinda Swan | 2017 | $19,000 | $24,000 | (est) |
| Ken Leung | 2017 | $14,000 | $18,000 | (est) |
| Eme Ikwuakor | 2017 | $11,000 | $15,000 | (est) |
| Isabelle Cornish | 2017 | $10,000 | $13,000 | (est) |
| Ellen Woglom | 2017 | $9,000 | $11,000 | (est) |
| Iwan Rheon | 2017 | $8,000 | $10,000 | (est) |
Aggregated Reviews
Rotten Tomatoes critic scoreN/A
RT critic review count0
Rotten Tomatoes audience scoreN/A
RT audience rating count0
IMDb rating5.2
IMDb votes944
Box Office ?
| Category | Year | Reported | Inflation Adjusted |
|---|---|---|---|
| Domestic | 2017 | $1,521,787 | $1,947,713 |
| International | 2017 | $1,330,495 | $1,702,882 |
| Worldwide | 2017 | $2,852,282 | $3,650,595 |
Earnings / Profitability
| Category | Year | Reported | Inflation Adjusted |
|---|---|---|---|
| Revenues | |||
| Theatrical Net Revenue | 2017 | $1,293,092 | $1,655,009 |
| Digital Rentals ? | 2017 | $2,406,000 | $3,079,405 |
| Digital Purchases ? | 2017 | $2,685,000 | $3,436,493 |
| Physical Rentals ? | 2017 | $1,795,000 | $2,297,395 |
| Physical Purchases ? | 2017 | $5,156,000 | $6,599,091 |
| TV & Streaming Revenue | 2017 | $608,715 | $779,085 |
| Total Revenues | 2017 | $13,943,806 | $17,846,479 |
| Expenses | |||
| Budget ? | 2017 | $1,771,000 (est) | $2,266,678 (est) |
| Print & Advertising (P&A) ? | 2017 | $2,710,000 (est) | $3,468,490 (est) |
| Participations | 2017 | $558,000 | $714,176 |
| Residuals ? | 2017 | $689,000 | $881,841 |
| Interest & Overhead | 2017 | $354,200 | $453,336 |
| Total Expenses | 2017 | $6,082,200 | $7,784,521 |
| Movie Net Profit or Loss | 2017 | $7,861,606 | $10,061,958 |
Similar Movies
| Poster | Movie | Year | Match | Overall | Est. Profit |
|---|---|---|---|---|---|
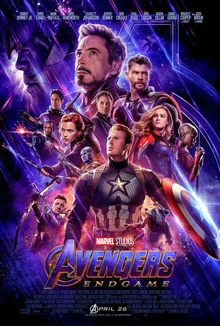 | Avengers: Endgame | 2019 | Shared genres: 7 | 97.9 | $685,779,490 |
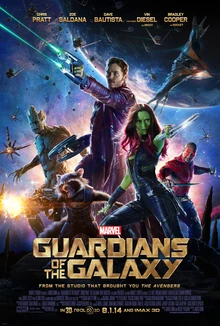 | Guardians of the Galaxy | 2014 | Shared genres: 7 | 97.6 | $72,200,110 |
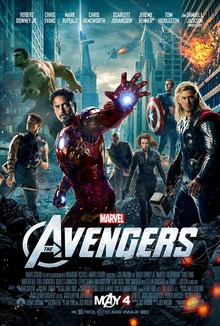 | The Avengers | 2012 | Shared genres: 7 | 97.4 | $362,859,255 |
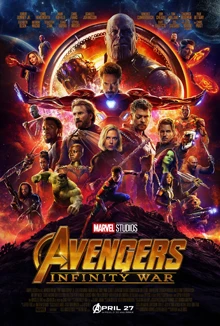 | Avengers: Infinity War | 2018 | Shared genres: 7 | 97.4 | $328,868,895 |
 | Captain America: Civil War | 2016 | Shared genres: 7 | 97.2 | $82,967,486 |