Synopsis
The epic next chapter in the cinematic Monsterverse pits two of the greatest icons in motion picture history against each other--the fearsome Godzilla and the mighty Kong--with humanity caught in the balance.
Scores
Overall Score
93.4
Popularity Percentile (Year)
96.3%
Box Office Percentile (Year)
98.6%
Review Aggregate
78.0
Critic Consensus
Critic reception is largely positive, with 76% of 392 logged reviews marked Fresh. Across reviews, critics repeatedly emphasize thin plot, visually striking, gritty. Most critics frame the film as an effective delivery of its core style and intent.
thin plotvisually strikinggrittyaction-packedfunnystylizedemotionalrealisticsuspensefulfamily-friendly
Cast
| Cast | Year | Reported Salary | Inflation Adjusted | Notes |
|---|---|---|---|---|
| Alexander Skarsgård | 2021 | $17,627,000 | $20,405,000 | (est) |
| Millie Bobby Brown | 2021 | $10,851,000 | $12,561,000 | (est) |
| Rebecca Hall | 2021 | $8,170,000 | $9,457,000 | (est) |
| Brian Tyree Henry | 2021 | $6,680,000 | $7,732,000 | (est) |
| Shun Oguri | 2021 | $5,714,000 | $6,614,000 | (est) |
| Eiza González | 2021 | $5,029,000 | $5,821,000 | (est) |
| Julian Dennison | 2021 | $4,515,000 | $5,226,000 | (est) |
| Lance Reddick | 2021 | $4,112,000 | $4,760,000 | (est) |
| Kyle Chandler | 2021 | $3,786,000 | $4,383,000 | (est) |
| Demián Bichir | 2021 | $3,517,000 | $4,071,000 | (est) |
Aggregated Reviews
Rotten Tomatoes critic score76.0
RT critic review count392
Rotten Tomatoes audience score91.0
RT audience rating count10,000
IMDb rating6.3
IMDb votes260,488
Box Office ?
| Category | Year | Reported | Inflation Adjusted |
|---|---|---|---|
| Domestic | 2021 | $100,916,096 | $116,816,901 |
| International | 2021 | $369,200,000 | $427,372,854 |
| Worldwide | 2021 | $470,116,100 | $544,189,760 |
Earnings / Profitability
| Category | Year | Reported | Inflation Adjusted |
|---|---|---|---|
| Revenues | |||
| Theatrical Net Revenue | 2021 | $198,138,048 | $229,357,592 |
| Digital Rentals ? | 2021 | $9,534,000 | $11,036,221 |
| Digital Purchases ? | 2021 | $10,735,000 | $12,426,456 |
| Physical Rentals ? | 2021 | $2,425,000 | $2,807,094 |
| Physical Purchases ? | 2021 | $7,759,000 | $8,981,544 |
| TV & Streaming Revenue | 2021 | $25,229,024 | $29,204,225 |
| Total Revenues | 2021 | $253,820,072 | $293,813,133 |
| Expenses | |||
| Budget ? | 2021 | $200,000,000 | $231,512,922 |
| Print & Advertising (P&A) ? | 2021 | $63,218,000 (est) | $73,178,920 (est) |
| Participations | 2021 | $5,076,000 | $5,875,798 |
| Residuals ? | 2021 | $2,568,000 | $2,972,626 |
| Interest & Overhead | 2021 | $24,000,000 | $27,781,551 |
| Total Expenses | 2021 | $294,862,000 | $341,321,816 |
| Movie Net Profit or Loss | 2021 | $-41,041,928 | $-47,508,683 |
Similar Movies
| Poster | Movie | Year | Match | Overall | Est. Profit |
|---|---|---|---|---|---|
 | Godzilla x Kong: The New Empire | 2024 | Shared franchise (3) | 89.7 | $28,269,016 |
 | Kong: Skull Island | 2017 | Shared franchise (2) | 92.3 | $-37,475,800 |
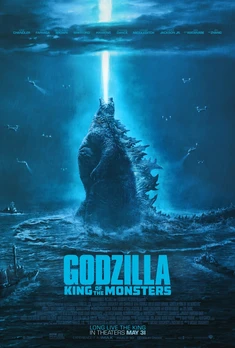 | Godzilla: King of the Monsters | 2019 | Shared franchise (2) | 89.0 | $-98,576,898 |
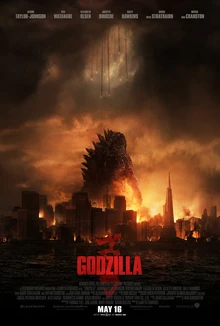 | Godzilla | 2014 | Shared franchise (2) | 71.0 | $-266,215,809 |
 | Godzilla | 1998 | Shared franchise (1) | 83.9 | $64,140,146 |