Synopsis
Disaster in a New York tunnel as explosions collapse both ends of it. One hero tries to help the people inside find their way to safety.
Scores
Overall Score
73.4
Popularity Percentile (Year)
81.4%
Box Office Percentile (Year)
82.5%
Review Aggregate
39.1
Critic Consensus
Critic reception is largely negative, with 38% of 29 logged reviews marked Fresh. Across reviews, critics repeatedly emphasize thin plot, coming of age, character-driven. Many reviews cite thin plot as the main reasons it falls short.
thin plotcoming of agecharacter-drivensuspensefulstylizedfunny
Cast
| Cast | Year | Reported Salary | Inflation Adjusted | Notes |
|---|---|---|---|---|
| Sylvester Stallone | 1996 | $17,500,000 source | $34,988,848 | reported |
| Amy Brenneman | 1996 | $3,134,000 | $6,265,000 | (est) |
| Viggo Mortensen | 1996 | $2,359,000 | $4,717,000 | (est) |
| Dan Hedaya | 1996 | $1,929,000 | $3,857,000 | (est) |
| Jay O. Sanders | 1996 | $1,650,000 | $3,299,000 | (est) |
| Karen Young | 1996 | $1,452,000 | $2,904,000 | (est) |
| Claire Bloom | 1996 | $1,304,000 | $2,607,000 | (est) |
| Barry Newman | 1996 | $1,187,000 | $2,374,000 | (est) |
| Stan Shaw | 1996 | $1,093,000 | $2,186,000 | (est) |
Aggregated Reviews
Rotten Tomatoes critic score28.0
RT critic review count46
Rotten Tomatoes audience score37.0
RT audience rating count50,000
IMDb rating6.0
IMDb votes79,836
Box Office ?
| Category | Year | Reported | Inflation Adjusted |
|---|---|---|---|
| Domestic | 1996 | $33,023,468 | $66,025,892 |
| International | 1996 | N/A | N/A |
| Worldwide | 1996 | $33,023,468 | $66,025,892 |
Earnings / Profitability
| Category | Year | Reported | Inflation Adjusted |
|---|---|---|---|
| Revenues | |||
| Theatrical Net Revenue | 1996 | $16,511,734 | $33,012,946 |
| Digital Rentals ? | 1996 | N/A | N/A |
| Digital Purchases ? | 1996 | N/A | N/A |
| Physical Rentals ? | 1996 | $33,507,000 | $66,992,648 |
| Physical Purchases ? | 1996 | $39,698,000 | $79,370,703 |
| TV & Streaming Revenue | 1996 | $8,255,867 | $16,506,473 |
| Total Revenues | 1996 | $97,972,601 | $195,882,770 |
| Expenses | |||
| Budget ? | 1996 | $80,000,000 | $159,949,020 |
| Print & Advertising (P&A) ? | 1996 | $12,153,000 (est) | $24,298,256 (est) |
| Participations | 1996 | $1,959,000 | $3,916,752 |
| Residuals ? | 1996 | $5,804,000 | $11,604,301 |
| Interest & Overhead | 1996 | $12,000,000 | $23,992,353 |
| Total Expenses | 1996 | $111,916,000 | $223,760,682 |
| Movie Net Profit or Loss | 1996 | $-13,943,399 | $-27,877,913 |
Similar Movies
| Poster | Movie | Year | Match | Overall | Est. Profit |
|---|---|---|---|---|---|
 | Deepwater Horizon | 2016 | Shared genres: 5 | 88.9 | $-61,727,115 |
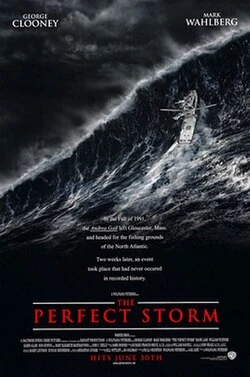 | The Perfect Storm | 2000 | Shared genres: 5 | 87.2 | $36,857,375 |
 | The Grey | 2012 | Shared genres: 5 | 86.4 | $19,593,761 |
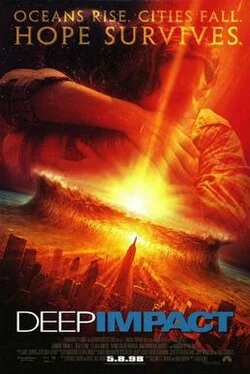 | Deep Impact | 1998 | Shared genres: 5 | 84.3 | $11,912,478 |
 | The Finest Hours | 2016 | Shared genres: 5 | 79.4 | $-77,690,714 |