Synopsis
Storm trackers, thrill-seekers, and everyday townspeople document an unprecedented onslaught of tornadoes touching down in the town of Silverton.
Scores
Overall Score
77.2
Popularity Percentile (Year)
82.1%
Box Office Percentile (Year)
93.4%
Review Aggregate
37.6
Critic Consensus
Critic reception is largely negative, with 21% of 157 logged reviews marked Fresh. Across reviews, critics repeatedly emphasize thin plot, visually striking, stylized. Many reviews cite thin plot as the main reasons it falls short.
thin plotvisually strikingstylizedcharacter-drivenscarysuspensefulfunnyrealisticdarksatirical
Cast
| Cast | Year | Reported Salary | Inflation Adjusted | Notes |
|---|---|---|---|---|
| Richard Armitage | 2014 | $4,313,000 | $5,716,000 | (est) |
| Sarah Wayne Callies | 2014 | $2,655,000 | $3,519,000 | (est) |
| Matt Walsh | 2014 | $1,999,000 | $2,649,000 | (est) |
| Alycia Debnam-Carey | 2014 | $1,634,000 | $2,166,000 | (est) |
| Arlen Escarpeta | 2014 | $1,398,000 | $1,853,000 | (est) |
Aggregated Reviews
Rotten Tomatoes critic score21.0
RT critic review count157
Rotten Tomatoes audience score42.0
RT audience rating count25,000
IMDb rating5.8
IMDb votes73,535
Box Office ?
| Category | Year | Reported | Inflation Adjusted |
|---|---|---|---|
| Domestic | 2014 | $47,602,192 | $63,087,485 |
| International | 2014 | $113,900,000 | $150,952,388 |
| Worldwide | 2014 | $161,502,190 | $214,039,870 |
Earnings / Profitability
| Category | Year | Reported | Inflation Adjusted |
|---|---|---|---|
| Revenues | |||
| Theatrical Net Revenue | 2014 | $69,361,096 | $91,924,698 |
| Digital Rentals ? | 2014 | $4,401,000 | $5,832,673 |
| Digital Purchases ? | 2014 | $3,486,000 | $4,620,018 |
| Physical Rentals ? | 2014 | $5,016,000 | $6,647,736 |
| Physical Purchases ? | 2014 | $13,522,000 | $17,920,792 |
| TV & Streaming Revenue | 2014 | $11,900,548 | $15,771,871 |
| Total Revenues | 2014 | $107,686,644 | $142,717,788 |
| Expenses | |||
| Budget ? | 2014 | $50,000,000 | $66,265,315 |
| Print & Advertising (P&A) ? | 2014 | $62,500,000 (est) | $82,831,644 (est) |
| Participations | 2014 | $2,154,000 | $2,854,710 |
| Residuals ? | 2014 | $2,195,000 | $2,909,047 |
| Interest & Overhead | 2014 | $7,500,000 | $9,939,797 |
| Total Expenses | 2014 | $124,349,000 | $164,800,513 |
| Movie Net Profit or Loss | 2014 | $-16,662,356 | $-22,082,725 |
Similar Movies
| Poster | Movie | Year | Match | Overall | Est. Profit |
|---|---|---|---|---|---|
 | Deepwater Horizon | 2016 | Shared genres: 5 | 88.9 | $-61,727,115 |
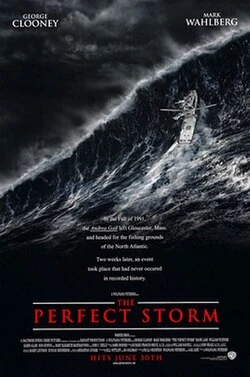 | The Perfect Storm | 2000 | Shared genres: 5 | 87.2 | $36,857,375 |
 | The Grey | 2012 | Shared genres: 5 | 86.4 | $19,593,761 |
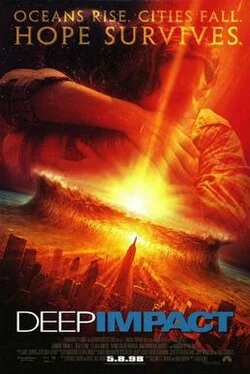 | Deep Impact | 1998 | Shared genres: 5 | 84.3 | $11,912,478 |
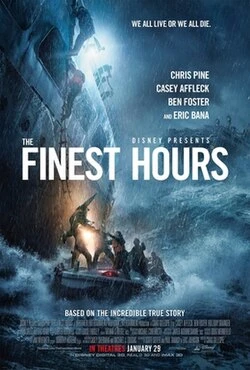 | The Finest Hours | 2016 | Shared genres: 5 | 79.4 | $-77,690,714 |