Synopsis
Batman is manipulated by Lex Luthor to fear Superman. Superman´s existence is meanwhile dividing the world and he is framed for murder during an international crisis. The heroes clash and force the neutral Wonder Woman to reemerge.
Scores
Overall Score
89.2
Popularity Percentile (Year)
99.4%
Box Office Percentile (Year)
99.1%
Review Aggregate
49.2
Critic Consensus
Critic reception is largely negative, with 28% of 436 logged reviews marked Fresh. Across reviews, critics repeatedly emphasize thin plot, dark, visually striking. Many reviews cite pacing issues, thin plot as the main reasons it falls short.
thin plotdarkvisually strikingpacing issuesuneven tonecharacter-drivengrittyaction-packedemotionalmacabre
Cast
| Cast | Year | Reported Salary | Inflation Adjusted | Notes |
|---|---|---|---|---|
| Ben Affleck | 2016 | $23,200,000 | $30,324,000 | (est) |
| Henry Cavill | 2016 | $14,281,000 | $18,667,000 | (est) |
| Amy Adams | 2016 | $10,752,000 | $14,054,000 | (est) |
| Jesse Eisenberg | 2016 | $8,791,000 | $11,491,000 | (est) |
| Diane Lane | 2016 | $7,520,000 | $9,829,000 | (est) |
| Laurence Fishburne | 2016 | $6,619,000 | $8,651,000 | (est) |
| Jeremy Irons | 2016 | $5,942,000 | $7,766,000 | (est) |
| Holly Hunter | 2016 | $5,412,000 | $7,073,000 | (est) |
| Gal Gadot | 2016 | $300,000 source | $392,125 | reported |
Aggregated Reviews
Rotten Tomatoes critic score28.0
RT critic review count436
Rotten Tomatoes audience score63.0
RT audience rating count100,000
IMDb rating6.4
IMDb votes780,158
Box Office ?
| Category | Year | Reported | Inflation Adjusted |
|---|---|---|---|
| Domestic | 2016 | $330,360,194 | $431,808,304 |
| International | 2016 | $544,000,000 | $711,053,333 |
| Worldwide | 2016 | $874,360,194 | $1,142,861,637 |
Earnings / Profitability
| Category | Year | Reported | Inflation Adjusted |
|---|---|---|---|
| Revenues | |||
| Theatrical Net Revenue | 2016 | $382,780,097 | $500,325,485 |
| Digital Rentals ? | 2016 | $5,021,000 | $6,562,865 |
| Digital Purchases ? | 2016 | $5,119,000 | $6,690,960 |
| Physical Rentals ? | 2016 | $4,408,000 | $5,761,623 |
| Physical Purchases ? | 2016 | $12,440,000 | $16,260,117 |
| TV & Streaming Revenue | 2016 | $115,626,068 | $151,132,906 |
| Total Revenues | 2016 | $525,394,165 | $686,733,956 |
| Expenses | |||
| Budget ? | 2016 | $250,000,000 | $326,770,833 |
| Print & Advertising (P&A) ? source | 2016 | $160,000,000 | $209,133,333 |
| Participations | 2016 | $42,032,000 | $54,939,327 |
| Residuals ? | 2016 | $7,103,000 | $9,284,213 |
| Interest & Overhead | 2016 | $30,000,000 | $39,212,500 |
| Total Expenses | 2016 | $489,135,000 | $639,340,206 |
| Movie Net Profit or Loss | 2016 | $36,259,165 | $47,393,750 |
Similar Movies
| Poster | Movie | Year | Match | Overall | Est. Profit |
|---|---|---|---|---|---|
 | Man of Steel | 2013 | Shared franchise (2) | 92.7 | $-10,807,496 |
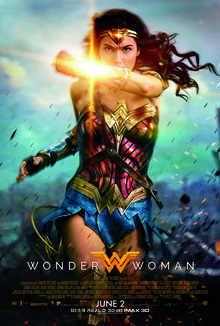 | Wonder Woman | 2017 | Shared franchise (1) | 96.1 | $145,861,897 |
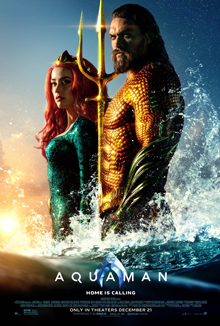 | Aquaman | 2018 | Shared franchise (1) | 93.1 | $167,352,536 |
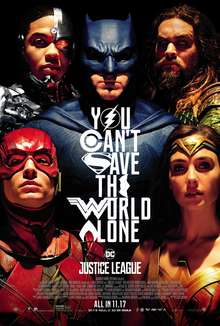 | Justice League | 2017 | Shared franchise (1) | 89.3 | $-104,876,050 |
 | Suicide Squad | 2016 | Shared franchise (1) | 88.3 | $66,114,046 |