Synopsis
When the Dark Elves attempt to plunge the universe into darkness, Thor must embark on a perilous and personal journey that will reunite him with doctor Jane Foster.
Scores
Overall Score
93.0
Popularity Percentile (Year)
99.2%
Box Office Percentile (Year)
98.6%
Review Aggregate
69.5
Critic Consensus
Critic reception is mixed, with 68% of 288 logged reviews marked Fresh. Across reviews, critics repeatedly emphasize dark, thin plot, funny. Common reservations focus on thin plot, even when reviewers praise standout elements.
darkthin plotfunnyvisually strikingfamily-friendlyaction-packedgrittycharacter-drivenrealisticromantic
Cast
| Cast | Year | Reported Salary | Inflation Adjusted | Notes |
|---|---|---|---|---|
| Chris Hemsworth | 2013 | $10,951,000 | $14,744,000 | (est) |
| Natalie Portman | 2013 | $1,000,000 source | $1,346,352 | reported |
| Tom Hiddleston | 2013 | $5,075,000 | $6,833,000 | (est) |
| Stellan Skarsgård | 2013 | $4,150,000 | $5,587,000 | (est) |
| Idris Elba | 2013 | $3,550,000 | $4,779,000 | (est) |
| Christopher Eccleston | 2013 | $3,124,000 | $4,206,000 | (est) |
| Adewale Akinnuoye-Agbaje | 2013 | $2,805,000 | $3,776,000 | (est) |
| Kat Dennings | 2013 | $2,554,000 | $3,439,000 | (est) |
| Ray Stevenson | 2013 | $1,000,000 source | $1,346,352 | reported |
| Zachary Levi | 2013 | $2,185,000 | $2,942,000 | (est) |
| Tadanobu Asano | 2013 | $2,044,000 | $2,752,000 | (est) |
| Jaimie Alexander | 2013 | $1,923,000 | $2,589,000 | (est) |
| Rene Russo | 2013 | $1,818,000 | $2,448,000 | (est) |
| Anthony Hopkins | 2013 | $1,727,000 | $2,324,000 | (est) |
Aggregated Reviews
Rotten Tomatoes critic score67.0
RT critic review count288
Rotten Tomatoes audience score74.0
RT audience rating count250,000
IMDb rating6.7
IMDb votes760,907
Box Office ?
| Category | Year | Reported | Inflation Adjusted |
|---|---|---|---|
| Domestic | 2013 | $206,362,140 | $277,836,045 |
| International | 2013 | $438,421,000 | $590,268,915 |
| Worldwide | 2013 | $644,783,170 | $868,105,000 |
Earnings / Profitability
| Category | Year | Reported | Inflation Adjusted |
|---|---|---|---|
| Revenues | |||
| Theatrical Net Revenue | 2013 | $278,549,470 | $375,025,588 |
| Digital Rentals ? | 2013 | $5,570,000 | $7,499,180 |
| Digital Purchases ? | 2013 | $3,330,000 | $4,483,352 |
| Physical Rentals ? | 2013 | $7,199,000 | $9,692,387 |
| Physical Purchases ? | 2013 | $18,654,000 | $25,114,847 |
| TV & Streaming Revenue | 2013 | $57,781,399 | $77,794,092 |
| Total Revenues | 2013 | $371,083,869 | $499,609,446 |
| Expenses | |||
| Budget ? | 2013 | $170,000,000 | $228,879,811 |
| Print & Advertising (P&A) ? | 2013 | $134,116,000 (est) | $180,567,322 (est) |
| Participations | 2013 | $29,687,000 | $39,969,147 |
| Residuals ? | 2013 | $4,993,000 | $6,722,335 |
| Interest & Overhead | 2013 | $20,400,000 | $27,465,577 |
| Total Expenses | 2013 | $359,196,000 | $483,604,191 |
| Movie Net Profit or Loss | 2013 | $11,887,869 | $16,005,254 |
Similar Movies
| Poster | Movie | Year | Match | Overall | Est. Profit |
|---|---|---|---|---|---|
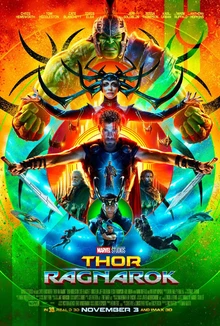 | Thor: Ragnarok | 2017 | Shared franchise (2) | 97.1 | $78,916,095 |
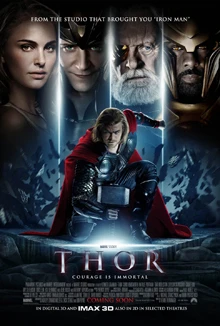 | Thor | 2011 | Shared franchise (2) | 94.0 | $-13,662,716 |
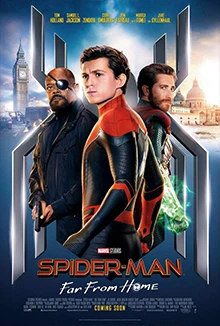 | Spider-Man: Far from Home | 2019 | Shared franchise (1) | 97.0 | $77,501,645 |
 | Doctor Strange | 2016 | Shared franchise (1) | 96.2 | $33,953,290 |
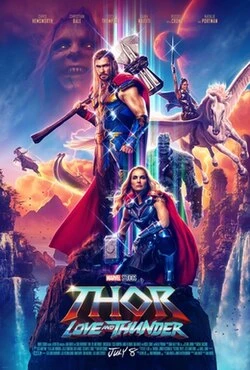 | Thor: Love and Thunder | 2022 | Shared franchise (2) | 91.8 | $36,960,831 |