Synopsis
The Coast Guard makes a daring rescue attempt off the coast of Cape Cod after a pair of oil tankers are destroyed during a blizzard in 1952.
Scores
Overall Score
79.4
Popularity Percentile (Year)
81.6%
Box Office Percentile (Year)
84.6%
Review Aggregate
65.5
Critic Consensus
Critic reception is mixed, with 64% of 200 logged reviews marked Fresh. Across reviews, critics repeatedly emphasize thin plot, historical, suspenseful. Common reservations focus on thin plot, even when reviewers praise standout elements.
thin plothistoricalsuspensefulromanticcharacter-drivenemotionallightheartedvisually strikingupliftingrealistic
Cast
| Cast | Year | Reported Salary | Inflation Adjusted | Notes |
|---|---|---|---|---|
| Chris Pine | 2016 | $6,259,000 | $8,182,000 | (est) |
| Casey Affleck | 2016 | $3,853,000 | $5,036,000 | (est) |
| Ben Foster | 2016 | $2,901,000 | $3,792,000 | (est) |
| Holliday Grainger | 2016 | $2,372,000 | $3,100,000 | (est) |
| John Ortiz | 2016 | $2,029,000 | $2,652,000 | (est) |
| Eric Bana | 2016 | $1,786,000 | $2,334,000 | (est) |
Aggregated Reviews
Rotten Tomatoes critic score64.0
RT critic review count200
Rotten Tomatoes audience score66.0
RT audience rating count10,000
IMDb rating6.7
IMDb votes73,484
Box Office ?
| Category | Year | Reported | Inflation Adjusted |
|---|---|---|---|
| Domestic | 2016 | $27,569,558 | $36,035,713 |
| International | 2016 | $24,529,532 | $32,062,145 |
| Worldwide | 2016 | $52,099,088 | $68,097,856 |
Earnings / Profitability
| Category | Year | Reported | Inflation Adjusted |
|---|---|---|---|
| Revenues | |||
| Theatrical Net Revenue | 2016 | $23,596,592 | $30,842,715 |
| Digital Rentals ? | 2016 | $4,037,000 | $5,276,696 |
| Digital Purchases ? | 2016 | $4,115,000 | $5,378,648 |
| Physical Rentals ? | 2016 | $3,544,000 | $4,632,304 |
| Physical Purchases ? | 2016 | $10,002,000 | $13,073,449 |
| TV & Streaming Revenue | 2016 | $6,616,694 | $8,648,571 |
| Total Revenues | 2016 | $51,911,286 | $67,852,383 |
| Expenses | |||
| Budget ? | 2016 | $80,000,000 | $104,566,676 |
| Print & Advertising (P&A) ? source | 2016 | $35,000,000 | $45,747,921 |
| Participations | 2016 | $1,038,000 | $1,356,753 |
| Residuals ? | 2016 | $1,564,000 | $2,044,279 |
| Interest & Overhead | 2016 | $12,000,000 | $15,685,001 |
| Total Expenses | 2016 | $129,602,000 | $169,400,630 |
| Movie Net Profit or Loss | 2016 | $-77,690,714 | $-101,548,247 |
Similar Movies
| Poster | Movie | Year | Match | Overall | Est. Profit |
|---|---|---|---|---|---|
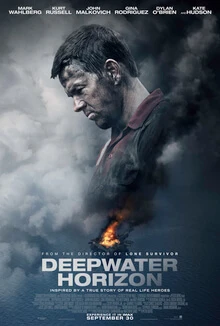 | Deepwater Horizon | 2016 | Shared genres: 7 | 88.9 | $-61,727,115 |
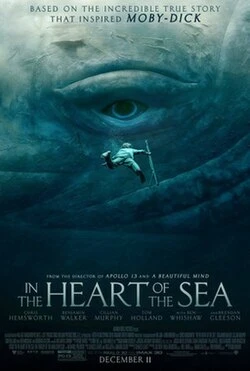 | In the Heart of the Sea | 2015 | Shared genres: 7 | 82.4 | $-90,577,639 |
 | Gravity | 2013 | Shared genres: 6 | 96.5 | $103,910,306 |
 | Blade Runner 2049 | 2017 | Shared genres: 6 | 94.9 | $-108,074,380 |
 | War for the Planet of the Apes | 2017 | Shared genres: 6 | 94.8 | $-8,379,627 |