Synopsis
A young fugitive prince and princess must stop a villain who unknowingly threatens to destroy the world with a special dagger that enables the magic sand inside to reverse time.
Scores
Overall Score
87.7
Popularity Percentile (Year)
96.6%
Box Office Percentile (Year)
97.0%
Review Aggregate
51.4
Critic Consensus
Critic reception is mixed, with 37% of 227 logged reviews marked Fresh. Across reviews, critics repeatedly emphasize thin plot, visually striking, family-friendly. Common reservations focus on thin plot, even when reviewers praise standout elements.
thin plotvisually strikingfamily-friendlyfunnyromanticcoming of ageaction-packedupliftinggrittyemotional
Cast
| Cast | Year | Reported Salary | Inflation Adjusted | Notes |
|---|---|---|---|---|
| Jake Gyllenhaal | 2010 | $10,000,000 source | $14,383,311 | reported |
| Ben Kingsley | 2010 | $17,531,000 | $25,215,000 | (est) |
| Gemma Arterton | 2010 | $13,199,000 | $18,984,000 | (est) |
| Alfred Molina | 2010 | $10,791,000 | $15,522,000 | (est) |
Aggregated Reviews
Rotten Tomatoes critic score37.0
RT critic review count227
Rotten Tomatoes audience score58.0
RT audience rating count250,000
IMDb rating6.5
IMDb votes313,588
Box Office ?
| Category | Year | Reported | Inflation Adjusted |
|---|---|---|---|
| Domestic | 2010 | $90,759,680 | $130,542,468 |
| International | 2010 | $245,606,000 | $353,262,741 |
| Worldwide | 2010 | $336,365,660 | $483,805,180 |
Earnings / Profitability
| Category | Year | Reported | Inflation Adjusted |
|---|---|---|---|
| Revenues | |||
| Theatrical Net Revenue | 2010 | $143,622,240 | $206,576,330 |
| Digital Rentals ? | 2010 | $5,470,000 | $7,867,671 |
| Digital Purchases ? | 2010 | $1,595,000 | $2,294,138 |
| Physical Rentals ? | 2010 | $12,840,000 | $18,468,171 |
| Physical Purchases ? | 2010 | $28,763,000 | $41,370,717 |
| TV & Streaming Revenue | 2010 | $22,689,920 | $32,635,617 |
| Total Revenues | 2010 | $214,980,160 | $309,212,644 |
| Expenses | |||
| Budget ? | 2010 | $200,000,000 | $287,666,214 |
| Print & Advertising (P&A) ? source | 2010 | $100,000,000 | $143,833,107 |
| Participations | 2010 | $4,300,000 | $6,184,824 |
| Residuals ? | 2010 | $4,444,000 | $6,391,943 |
| Interest & Overhead | 2010 | $24,000,000 | $34,519,946 |
| Total Expenses | 2010 | $332,744,000 | $478,596,034 |
| Movie Net Profit or Loss | 2010 | $-117,763,840 | $-169,383,390 |
Similar Movies
| Poster | Movie | Year | Match | Overall | Est. Profit |
|---|---|---|---|---|---|
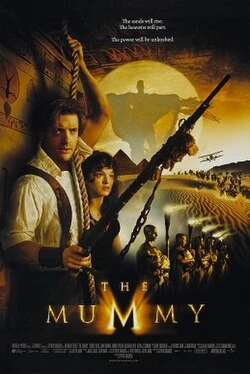 | The Mummy | 1999 | Shared genres: 7 | 90.3 | $45,793,769 |
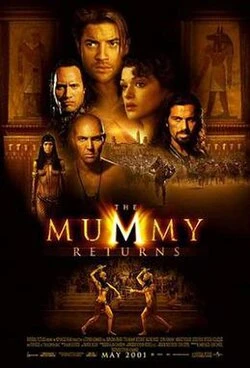 | The Mummy Returns | 2001 | Shared genres: 7 | 88.6 | $102,885,832 |
 | Wonder Woman | 2017 | Shared genres: 5 | 96.1 | $145,861,890 |
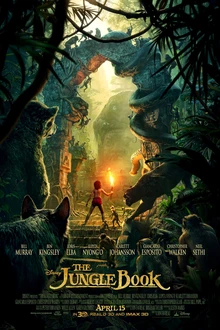 | The Jungle Book | 2016 | Shared genres: 5 | 95.5 | $136,030,752 |
 | Sonic the Hedgehog | 2020 | Shared genres: 5 | 92.1 | $68,921,651 |