Synopsis
When Tony Stark's world is torn apart by a formidable terrorist called the Mandarin, he starts an odyssey of rebuilding and retribution.
Scores
Overall Score
95.1
Popularity Percentile (Year)
99.8%
Box Office Percentile (Year)
99.8%
Review Aggregate
76.7
Critic Consensus
Critic reception is largely positive, with 79% of 327 logged reviews marked Fresh. Across reviews, critics repeatedly emphasize funny, dark, visually striking. Most critics frame the film as an effective delivery of its core style and intent.
funnydarkvisually strikingaction-packedpsychologicalsuspensefulgrittyrealisticcharacter-drivenlighthearted
Cast
| Cast | Year | Reported Salary | Inflation Adjusted | Notes |
|---|---|---|---|---|
| Robert Downey Jr. | 2013 | $16,836,000 | $22,667,000 | (est) |
| Gwyneth Paltrow | 2013 | $10,364,000 | $13,953,000 | (est) |
| Don Cheadle | 2013 | $6,000,000 source | $8,078,112 | reported |
| Guy Pearce | 2013 | $6,380,000 | $8,589,000 | (est) |
| Rebecca Hall | 2013 | $5,457,000 | $7,347,000 | (est) |
| Stéphanie Szostak | 2013 | $4,803,000 | $6,467,000 | (est) |
| James Badge Dale | 2013 | $4,312,000 | $5,805,000 | (est) |
| William Sadler | 2013 | $3,927,000 | $5,287,000 | (est) |
| Miguel Ferrer | 2013 | $3,616,000 | $4,869,000 | (est) |
| Jon Favreau | 2013 | $3,359,000 | $4,523,000 | (est) |
| Ben Kingsley | 2013 | $3,142,000 | $4,231,000 | (est) |
Aggregated Reviews
Rotten Tomatoes critic score79.0
RT critic review count327
Rotten Tomatoes audience score78.0
RT audience rating count250,000
IMDb rating7.1
IMDb votes944,073
Box Office ?
| Category | Year | Reported | Inflation Adjusted |
|---|---|---|---|
| Domestic | 2013 | $409,013,994 | $550,676,781 |
| International | 2013 | $805,797,258 | $1,084,886,695 |
| Worldwide | 2013 | $1,214,811,252 | $1,635,563,475 |
Earnings / Profitability
| Category | Year | Reported | Inflation Adjusted |
|---|---|---|---|
| Revenues | |||
| Theatrical Net Revenue | 2013 | $526,825,900 | $709,293,068 |
| Digital Rentals ? | 2013 | $5,689,000 | $7,659,396 |
| Digital Purchases ? | 2013 | $3,401,000 | $4,578,943 |
| Physical Rentals ? | 2013 | $7,352,000 | $9,898,379 |
| Physical Purchases ? | 2013 | $19,051,000 | $25,649,351 |
| TV & Streaming Revenue | 2013 | $143,154,898 | $192,736,873 |
| Total Revenues | 2013 | $705,473,798 | $949,816,011 |
| Expenses | |||
| Budget ? | 2013 | $200,000,000 | $269,270,386 |
| Print & Advertising (P&A) ? | 2013 | $150,442,000 (est) | $202,547,877 (est) |
| Participations | 2013 | $105,821,000 | $142,472,308 |
| Residuals ? | 2013 | $9,138,000 | $12,302,964 |
| Interest & Overhead | 2013 | $24,000,000 | $32,312,446 |
| Total Expenses | 2013 | $489,401,000 | $658,905,982 |
| Movie Net Profit or Loss | 2013 | $216,072,798 | $290,910,029 |
Similar Movies
| Poster | Movie | Year | Match | Overall | Est. Profit |
|---|---|---|---|---|---|
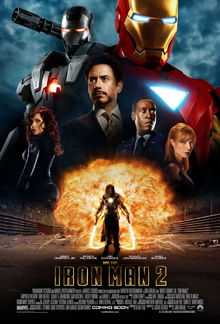 | Iron Man 2 | 2010 | Shared franchise (2) | 93.4 | $25,192,331 |
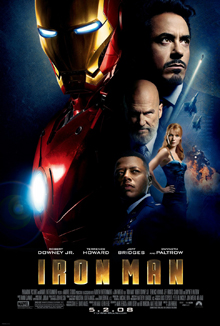 | Iron Man | 2008 | Shared franchise (2) | 97.2 | $68,016,356 |
 | Avengers: Endgame | 2019 | Shared franchise (1) | 97.9 | $685,779,490 |
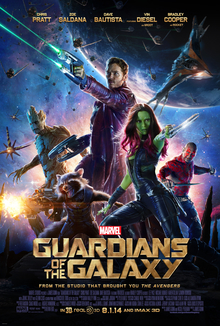 | Guardians of the Galaxy | 2014 | Shared franchise (1) | 97.6 | $72,200,110 |
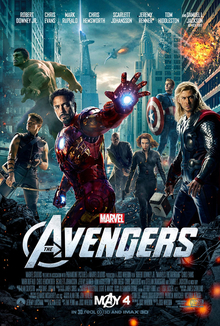 | The Avengers | 2012 | Shared franchise (1) | 97.4 | $362,859,255 |