Synopsis
When Hiccup and Toothless discover an ice cave that is home to hundreds of new wild dragons and the mysterious Dragon Rider, the two friends find themselves at the center of a battle to protect the peace.
Scores
Overall Score
95.1
Popularity Percentile (Year)
95.7%
Box Office Percentile (Year)
98.3%
Review Aggregate
87.8
Critic Consensus
Critic reception is largely positive, with 92% of 185 logged reviews marked Fresh. Across reviews, critics repeatedly emphasize emotional, family-friendly, visually striking. Most critics frame the film as an effective delivery of its core style and intent.
emotionalfamily-friendlyvisually strikingdarkfunnyupliftinggrittyscaryromanticcoming of age
Cast
| Cast | Year | Reported Salary | Inflation Adjusted | Notes |
|---|---|---|---|---|
| Jay Baruchel | 2014 | $10,462,000 | $13,866,000 | (est) |
| Cate Blanchett | 2014 | $6,440,000 | $8,535,000 | (est) |
| Gerard Butler | 2014 | $4,849,000 | $6,426,000 | (est) |
| Craig Ferguson | 2014 | $3,965,000 | $5,254,000 | (est) |
| America Ferrera | 2014 | $3,391,000 | $4,494,000 | (est) |
| Jonah Hill | 2014 | $2,985,000 | $3,956,000 | (est) |
| Christopher Mintz-Plasse | 2014 | $2,680,000 | $3,551,000 | (est) |
| T.J. Miller | 2014 | $2,440,000 | $3,234,000 | (est) |
| Kristen Wiig | 2014 | $2,247,000 | $2,978,000 | (est) |
| Djimon Hounsou | 2014 | $2,088,000 | $2,767,000 | (est) |
| Kit Harington | 2014 | $1,953,000 | $2,588,000 | (est) |
Aggregated Reviews
Rotten Tomatoes critic score92.0
RT critic review count185
Rotten Tomatoes audience score90.0
RT audience rating count100,000
IMDb rating7.8
IMDb votes390,687
Box Office ?
| Category | Year | Reported | Inflation Adjusted |
|---|---|---|---|
| Domestic | 2014 | $177,002,924 | $234,583,089 |
| International | 2014 | $444,534,595 | $589,144,497 |
| Worldwide | 2014 | $621,537,519 | $823,727,586 |
Earnings / Profitability
| Category | Year | Reported | Inflation Adjusted |
|---|---|---|---|
| Revenues | |||
| Theatrical Net Revenue | 2014 | $266,315,300 | $352,949,344 |
| Digital Rentals ? | 2014 | $5,089,000 | $6,744,484 |
| Digital Purchases ? | 2014 | $4,031,000 | $5,342,310 |
| Physical Rentals ? | 2014 | $5,801,000 | $7,688,102 |
| Physical Purchases ? | 2014 | $15,637,000 | $20,723,815 |
| TV & Streaming Revenue | 2014 | $49,560,819 | $65,683,265 |
| Total Revenues | 2014 | $346,434,119 | $459,131,318 |
| Expenses | |||
| Budget ? | 2014 | $145,000,000 | $192,169,413 |
| Print & Advertising (P&A) ? | 2014 | $103,353,000 (est) | $136,974,381 (est) |
| Participations | 2014 | $27,715,000 | $36,730,864 |
| Residuals ? | 2014 | $4,259,000 | $5,644,480 |
| Interest & Overhead | 2014 | $17,400,000 | $23,060,330 |
| Total Expenses | 2014 | $297,727,000 | $394,579,467 |
| Movie Net Profit or Loss | 2014 | $48,707,119 | $64,551,851 |
Similar Movies
| Poster | Movie | Year | Match | Overall | Est. Profit |
|---|---|---|---|---|---|
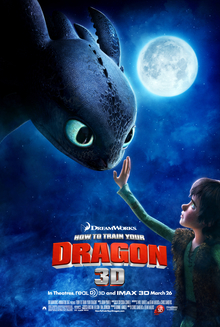 | How to Train Your Dragon | 2010 | Shared franchise (1) | 97.3 | $3,305,371 |
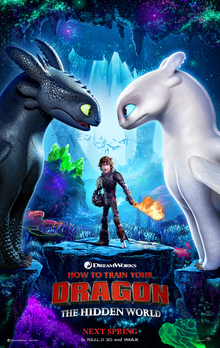 | How to Train Your Dragon: The Hidden World | 2019 | Shared franchise (1) | 93.8 | $37,361,614 |
 | Shrek | 2001 | Shared genres: 13 | 95.9 | $196,186,888 |
 | Rise of the Guardians | 2012 | Shared genres: 13 | 90.1 | $-100,877,867 |
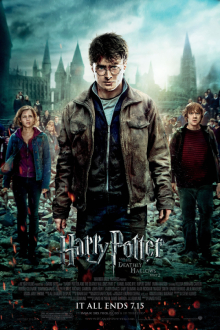 | Harry Potter and the Deathly Hallows: Part 2 | 2011 | Shared genres: 12 | 97.9 | $199,533,536 |