Synopsis
Into the world of the Emperor Penguins, who find their soul mates through song, a penguin is born who cannot sing. But he can tap dance something fierce!
Scores
Overall Score
90.8
Popularity Percentile (Year)
93.6%
Box Office Percentile (Year)
98.4%
Review Aggregate
70.9
Critic Consensus
No professional critic quote data was available to synthesize a consensus summary.
No tags
Cast
| Cast | Year | Reported Salary | Inflation Adjusted | Notes |
|---|---|---|---|---|
| Elijah Wood | 2006 | $7,954,000 | $12,377,000 | (est) |
| Robin Williams | 2006 | $4,896,000 | $7,619,000 | (est) |
| Brittany Murphy | 2006 | $3,687,000 | $5,736,000 | (est) |
| Hugh Jackman | 2006 | $3,014,000 | $4,690,000 | (est) |
| Nicole Kidman | 2006 | $2,578,000 | $4,012,000 | (est) |
| Hugo Weaving | 2006 | $2,269,000 | $3,531,000 | (est) |
| Anthony LaPaglia | 2006 | $2,037,000 | $3,170,000 | (est) |
| Magda Szubanski | 2006 | $1,855,000 | $2,887,000 | (est) |
| Steve Irwin | 2006 | $1,709,000 | $2,659,000 | (est) |
Aggregated Reviews
Rotten Tomatoes critic score76.0
RT critic review count169
Rotten Tomatoes audience score70.0
RT audience rating count250,000
IMDb rating6.4
IMDb votes209,110
Box Office ?
| Category | Year | Reported | Inflation Adjusted |
|---|---|---|---|
| Domestic | 2006 | $198,000,317 | $308,098,708 |
| International | 2006 | $186,335,291 | $289,947,325 |
| Worldwide | 2006 | $384,335,608 | $598,046,033 |
Earnings / Profitability
| Category | Year | Reported | Inflation Adjusted |
|---|---|---|---|
| Revenues | |||
| Theatrical Net Revenue | 2006 | $173,534,275 | $270,028,284 |
| Digital Rentals ? | 2006 | $592,000 | $921,183 |
| Digital Purchases ? | 2006 | $182,000 | $283,201 |
| Physical Rentals ? | 2006 | $18,718,000 | $29,126,174 |
| Physical Purchases ? | 2006 | $44,151,000 | $68,701,234 |
| TV & Streaming Revenue | 2006 | $55,440,089 | $86,267,638 |
| Total Revenues | 2006 | $292,617,364 | $455,327,713 |
| Expenses | |||
| Budget ? | 2006 | $100,000,000 | $155,605,159 |
| Print & Advertising (P&A) ? | 2006 | $62,784,000 (est) | $97,695,143 (est) |
| Participations | 2006 | $43,893,000 | $68,299,772 |
| Residuals ? | 2006 | $7,335,000 | $11,413,638 |
| Interest & Overhead | 2006 | $15,000,000 | $23,340,774 |
| Total Expenses | 2006 | $229,012,000 | $356,354,486 |
| Movie Net Profit or Loss | 2006 | $63,605,364 | $98,973,227 |
Similar Movies
| Poster | Movie | Year | Match | Overall | Est. Profit |
|---|---|---|---|---|---|
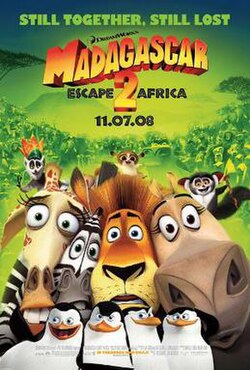 | Madagascar: Escape 2 Africa | 2008 | Shared genres: 8 | 90.9 | $40,691,303 |
 | Rio 2 | 2014 | Shared genres: 8 | 86.4 | $52,688,052 |
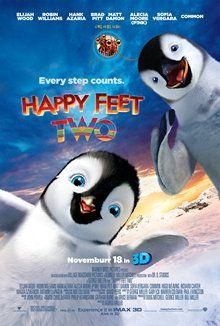 | Happy Feet Two | 2011 | Shared genres: 8 | 77.1 | $-185,151,233 |
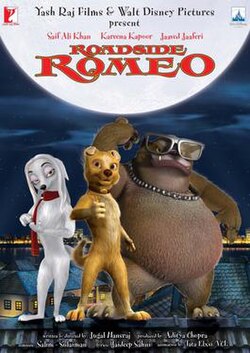 | Roadside Romeo | 2008 | Shared genres: 8 | 39.5 | $6,176,329 |
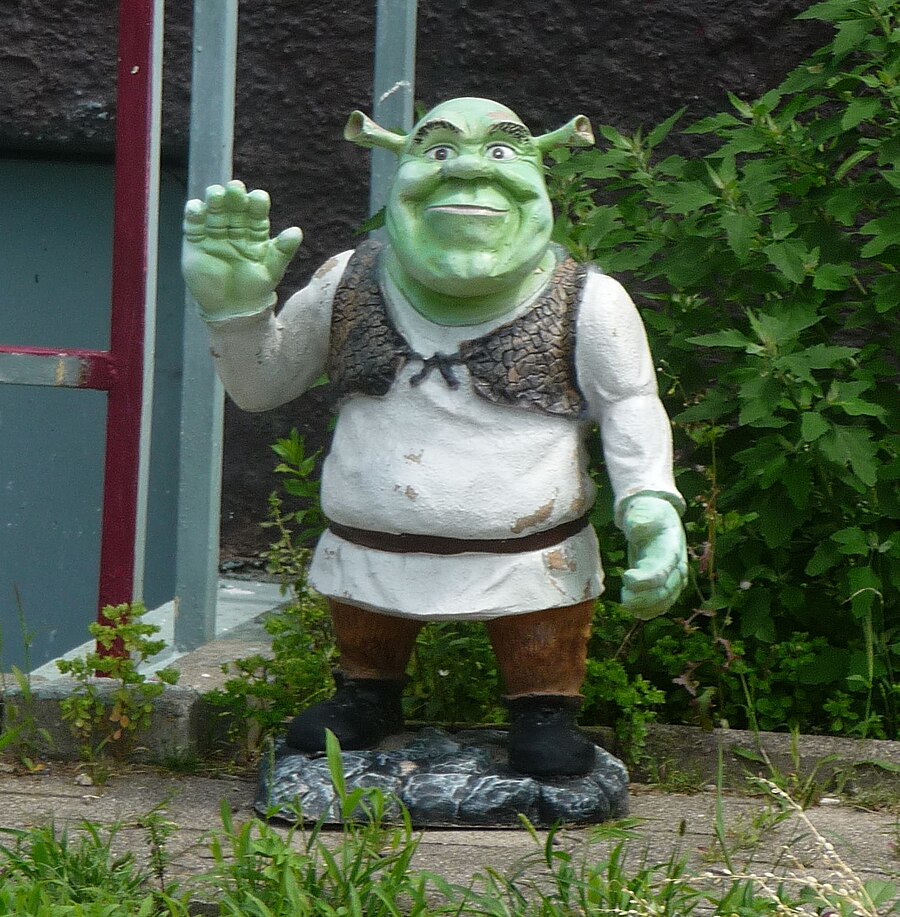 | Shrek | 2001 | Shared genres: 7 | 95.9 | $196,186,888 |