Synopsis
Four young outsiders teleport to an alternate and dangerous universe which alters their physical form in shocking ways. The four must learn to harness their new abilities and work together to save Earth from a former friend turned enemy.
Scores
Overall Score
79.5
Popularity Percentile (Year)
94.4%
Box Office Percentile (Year)
94.0%
Review Aggregate
20.6
Critic Consensus
Critic reception is largely negative, with 9% of 260 logged reviews marked Fresh. Across reviews, critics repeatedly emphasize thin plot, dark, visually striking. Many reviews cite pacing issues, thin plot as the main reasons it falls short.
thin plotdarkvisually strikingemotionalstylizedfunnypacing issuesgrittyuneven tonefamily-friendly
Cast
| Cast | Year | Reported Salary | Inflation Adjusted | Notes |
|---|---|---|---|---|
| Miles Teller | 2015 | $10,832,000 | $14,337,000 | (est) |
| Michael B. Jordan | 2015 | $6,668,000 | $8,826,000 | (est) |
| Kate Mara | 2015 | $5,020,000 | $6,645,000 | (est) |
| Jamie Bell | 2015 | $4,105,000 | $5,433,000 | (est) |
| Toby Kebbell | 2015 | $3,511,000 | $4,647,000 | (est) |
| Reg E. Cathey | 2015 | $3,090,000 | $4,090,000 | (est) |
| Tim Blake Nelson | 2015 | $2,774,000 | $3,672,000 | (est) |
Aggregated Reviews
Rotten Tomatoes critic score9.0
RT critic review count260
Rotten Tomatoes audience score18.0
RT audience rating count100,000
IMDb rating4.3
IMDb votes188,786
Box Office ?
| Category | Year | Reported | Inflation Adjusted |
|---|---|---|---|
| Domestic | 2015 | $56,117,548 | $74,278,797 |
| International | 2015 | $111,765,333 | $147,935,802 |
| Worldwide | 2015 | $167,882,881 | $222,214,598 |
Earnings / Profitability
| Category | Year | Reported | Inflation Adjusted |
|---|---|---|---|
| Revenues | |||
| Theatrical Net Revenue | 2015 | $72,764,907 | $96,313,719 |
| Digital Rentals ? | 2015 | $4,257,000 | $5,634,687 |
| Digital Purchases ? | 2015 | $4,464,000 | $5,908,678 |
| Physical Rentals ? | 2015 | $4,829,000 | $6,391,803 |
| Physical Purchases ? | 2015 | $12,940,000 | $17,127,755 |
| TV & Streaming Revenue | 2015 | $14,029,387 | $18,569,699 |
| Total Revenues | 2015 | $113,284,294 | $149,946,342 |
| Expenses | |||
| Budget ? | 2015 | $120,000,000 | $158,835,443 |
| Print & Advertising (P&A) ? | 2015 | $71,726,000 (est) | $94,938,592 (est) |
| Participations | 2015 | $2,266,000 | $2,999,343 |
| Residuals ? | 2015 | $2,248,000 | $2,975,517 |
| Interest & Overhead | 2015 | $14,400,000 | $19,060,253 |
| Total Expenses | 2015 | $210,640,000 | $278,809,148 |
| Movie Net Profit or Loss | 2015 | $-97,355,706 | $-128,862,806 |
Similar Movies
| Poster | Movie | Year | Match | Overall | Est. Profit |
|---|---|---|---|---|---|
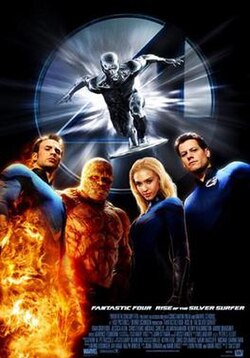 | Fantastic Four: Rise of the Silver Surfer | 2007 | Shared franchise (1) | 86.5 | $10,005,513 |
 | Fantastic Four | 2005 | Shared franchise (1) | 86.2 | $59,959,884 |
 | Spider-Man: No Way Home | 2021 | Shared genres: 7 | 98.2 | $629,996,173 |
 | Avengers: Endgame | 2019 | Shared genres: 7 | 97.9 | $685,779,490 |
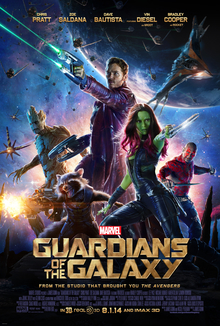 | Guardians of the Galaxy | 2014 | Shared genres: 7 | 97.6 | $72,200,110 |