Synopsis
The Red Ribbon Army from Goku's past has returned with two new androids to challenge him and his friends.
Scores
Overall Score
81.7
Popularity Percentile (Year)
71.9%
Box Office Percentile (Year)
90.2%
Review Aggregate
89.0
Critic Consensus
Critic reception is largely positive, with 95% of 58 logged reviews marked Fresh. Across reviews, critics repeatedly emphasize thin plot, stylized, visually striking. Most critics frame the film as an effective delivery of its core style and intent.
thin plotstylizedvisually strikingfunnyaction-packedlightheartedemotional
Cast
| Cast | Year | Reported Salary | Inflation Adjusted | Notes |
|---|---|---|---|---|
| see below | 2022 | $3,809,000 | $4,082,000 | (est) |
Aggregated Reviews
Rotten Tomatoes critic score95.0
RT critic review count58
Rotten Tomatoes audience score95.0
RT audience rating count2,500
IMDb rating7.1
IMDb votes17,765
Box Office ?
| Category | Year | Reported | Inflation Adjusted |
|---|---|---|---|
| Domestic | 2022 | $38,112,140 | $40,846,524 |
| International | 2022 | $48,450,000 | $51,926,082 |
| Worldwide | 2022 | $86,562,144 | $92,772,610 |
Earnings / Profitability
| Category | Year | Reported | Inflation Adjusted |
|---|---|---|---|
| Revenues | |||
| Theatrical Net Revenue | 2022 | $38,436,070 | $41,193,695 |
| Digital Rentals ? | 2022 | $5,617,000 | $6,019,996 |
| Digital Purchases ? | 2022 | $8,475,000 | $9,083,045 |
| Physical Rentals ? | 2022 | $1,527,000 | $1,636,556 |
| Physical Purchases ? | 2022 | $4,695,000 | $5,031,846 |
| TV & Streaming Revenue | 2022 | $9,528,035 | $10,211,631 |
| Total Revenues | 2022 | $68,278,105 | $73,176,769 |
| Expenses | |||
| Budget ? | 2022 | $7,324,000 (est) | $7,849,466 (est) |
| Print & Advertising (P&A) ? | 2022 | $11,231,000 (est) | $12,036,777 (est) |
| Participations | 2022 | $5,462,000 | $5,853,875 |
| Residuals ? | 2022 | $1,300,000 | $1,393,269 |
| Interest & Overhead | 2022 | $1,464,800 | $1,569,893 |
| Total Expenses | 2022 | $26,781,800 | $28,703,280 |
| Movie Net Profit or Loss | 2022 | $41,496,305 | $44,473,489 |
Similar Movies
| Poster | Movie | Year | Match | Overall | Est. Profit |
|---|---|---|---|---|---|
 | Demon Slayer: Kimetsu no Yaiba - The Movie: Mugen Train | 2021 | Shared genres: 5 | 92.4 | $173,051,476 |
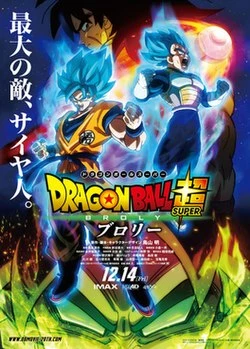 | Dragon Ball Super: Broly | 2019 | Shared genres: 5 | 84.9 | $46,258,301 |
 | The Boy and the Beast | 2016 | Shared genres: 5 | 78.5 | $18,512,470 |
 | Dragon Ball Z: Resurrection 'F' | 2015 | Shared genres: 5 | 77.3 | $30,541,120 |
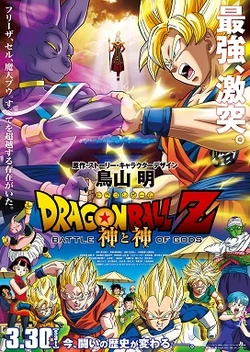 | Dragon Ball Z: Battle of Gods | 2014 | Shared genres: 5 | 76.7 | $19,091,649 |