
Warner Bros. Pictures
Dynamic entity page generated from imported ScreenProfits movie metadata.
Distributor
Studio
Production Company
Movies539
Years1991-2026
Avg Score73.6
Worldwide Gross$81,789,898,351
Associated Movies
| Poster | Movie | Year | Overall | Popularity % | Box Office % | Worldwide | Profit/Loss (Est.) | Profit (Inflation Adj) |
|---|---|---|---|---|---|---|---|---|

|
2016 | 89.5 | 96.2% | 94.4% | $208M | $58M | $79M | |

|
2015 | 89.5 | 96.4% | 91.3% | $110M | -$63M | -$84M | |

|
2016 | 89.5 | 97.7% | 92.2% | $156M | $5M | $8M | |

|
2018 | 89.4 | 97.4% | 96.1% | $298M | $26M | $36M | |

|
2025 | 89.3 | 95.0% | 84.0% | $37M | -$15M | -$15M | |

|
2017 | 89.3 | 97.9% | 98.2% | $661M | -$81M | -$96M | |

|
2016 | 89.2 | 99.4% | 99.1% | $874M | $78M | $113M | |

|
2018 | 89.1 | 93.6% | 94.7% | $175M | $7M | $11M | |

|
2006 | 89.0 | 92.5% | 86.3% | $69M | -$2M | -$3M | |

|
2023 | 89.0 | 93.0% | 90.9% | $147M | $43M | $45M | |

|
2018 | 89.0 | 95.0% | 97.6% | $428M | -$46M | -$56M | |

|
2003 | 88.9 | 98.3% | 98.5% | $427M | $31M | $60M | |

|
2008 | 88.8 | 97.4% | 95.4% | $223M | $22M | $35M | |

|
2011 | 88.7 | 94.4% | 90.3% | $137M | -$2M | $2K | |

|
The Matrix Resurrections
Recovery period
|
2021 | 88.7 | 97.0% | 93.7% | $157M | -$181M | -$209M |

|
2019 | 88.7 | 91.0% | 94.4% | $192M | -$75M | -$91M | |
|
2007 | 88.5 | 95.3% | 95.4% | $175M | $26M | $41M | |

|
2018 | 88.5 | 97.8% | 98.9% | $656M | $2M | $9M | |

|
2022 | 88.4 | 92.5% | 97.6% | $407M | -$94M | -$98M | |
|
2011 | 88.3 | 97.9% | 98.7% | $587M | $176M | $255M | |

|
2016 | 88.3 | 99.2% | 98.6% | $749M | $129M | $179M | |

|
2008 | 88.2 | 94.8% | 95.8% | $231M | $24M | $38M | |

|
King Richard
Recovery period
|
2021 | 88.1 | 90.3% | 84.6% | $40M | -$43M | -$50M |

|
2018 | 87.9 | 96.1% | 95.7% | $275M | -$66M | -$82M | |
|
2008 | 87.9 | 91.6% | 98.3% | $419M | $115M | $175M | |

|
2015 | 87.7 | 95.4% | 97.9% | $475M | $30M | $44M | |
|
The Conjuring: The Devil Made Me Do It
COVID-era
|
2021 | 87.6 | 90.8% | 95.2% | $206M | $35M | $43M |
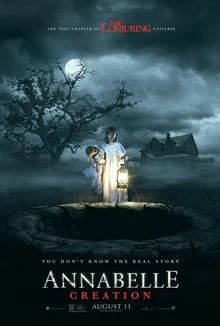
|
2017 | 87.6 | 90.2% | 95.5% | $307M | $125M | $165M | |
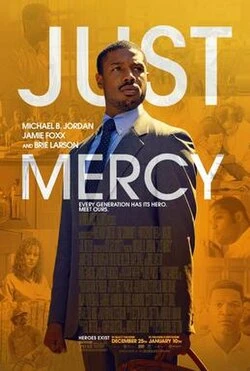
|
2019 | 87.5 | 88.1% | 86.7% | $51M | -$10M | -$12M | |
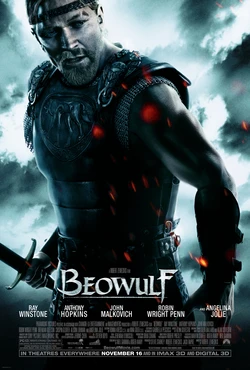
|
2007 | 87.4 | 92.4% | 95.8% | $196M | -$118M | -$178M | |
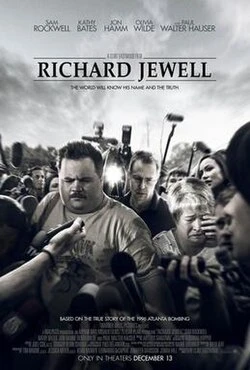
|
2019 | 87.3 | 91.2% | 84.8% | $45M | -$41M | -$50M | |

|
2022 | 87.2 | 85.6% | 95.3% | $208M | -$44M | -$46M | |
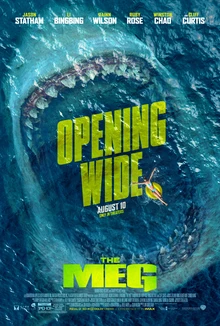
|
2018 | 87.2 | 95.8% | 98.2% | $529M | $5M | $11M | |
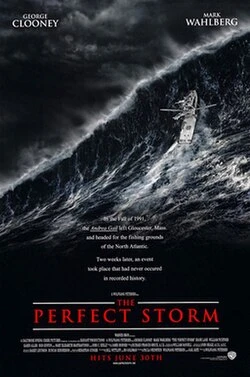
|
2000 | 87.2 | 92.0% | 97.9% | $329M | $21M | $46M | |
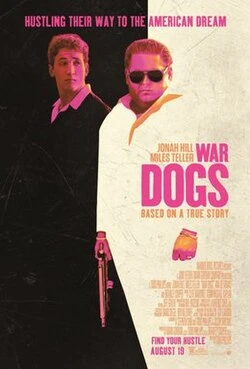
|
2016 | 87.1 | 95.5% | 88.0% | $86M | -$28M | -$37M | |

|
2015 | 87.1 | 92.5% | 78.4% | $31M | $3M | $5M | |

|
2023 | 87.0 | 89.0% | 89.8% | $131M | -$123M | -$127M | |

|
2015 | 86.9 | 94.8% | 93.7% | $159M | -$3B | -$3B | |

|
2014 | 86.9 | 95.2% | 96.6% | $338M | -$26M | -$32M | |

|
Mortal Kombat
COVID-era
|
2021 | 86.9 | 93.7% | 89.5% | $84M | -$46M | -$53M |
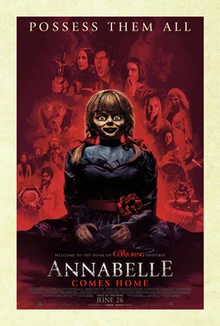
|
2019 | 86.8 | 89.9% | 95.3% | $231M | $21M | $27M | |

|
2015 | 86.8 | 91.5% | 90.3% | $100M | -$29M | -$37M | |

|
2000 | 86.8 | 94.3% | 94.5% | $213M | $51M | $97M | |
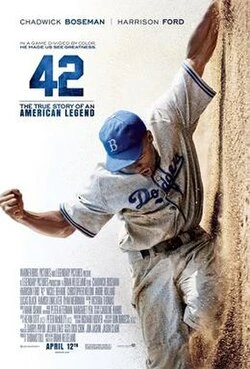
|
2013 | 86.7 | 87.9% | 88.6% | $97M | $11M | $17M | |
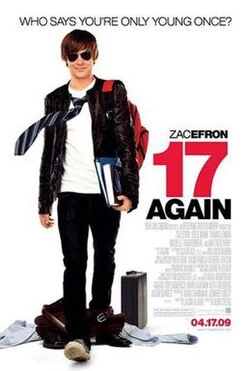
|
2009 | 86.6 | 93.6% | 91.5% | $136M | -$3M | -$3M | |

|
2003 | 86.4 | 84.9% | 97.8% | $265M | $47M | $86M | |
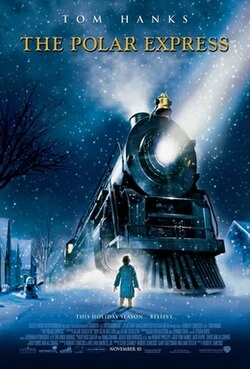
|
2004 | 86.4 | 89.2% | 97.3% | $286M | -$86M | -$139M | |

|
2016 | 86.1 | 90.3% | 92.0% | $149M | $74M | $99M | |
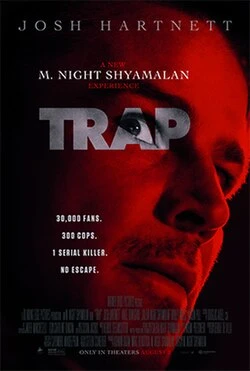
|
2024 | 85.9 | 93.4% | 91.2% | $84M | -$14M | -$13M | |

|
2007 | 85.8 | 88.7% | 93.7% | $146M | $13M | $21M |