Synopsis
Two years after the bachelor party in Las Vegas, Phil, Stu, Alan, and Doug jet to Thailand for Stu's wedding, but Stu's plan for subdued pre-wedding brunch goes seriously awry.
Scores
Overall Score
88.3
Popularity Percentile (Year)
97.9%
Box Office Percentile (Year)
98.7%
Review Aggregate
48.5
Critic Consensus
No professional critic quote data was available to synthesize a consensus summary.
No tags
Cast
| Cast | Year | Reported Salary | Inflation Adjusted | Notes |
|---|---|---|---|---|
| Bradley Cooper | 2011 | $5,777,000 | $8,058,000 | (est) |
| Ed Helms | 2011 | $3,556,000 | $4,960,000 | (est) |
| Zach Galifianakis | 2011 | $2,677,000 | $3,735,000 | (est) |
| Ken Jeong | 2011 | $2,189,000 | $3,053,000 | (est) |
| Jeffrey Tambor | 2011 | $1,873,000 | $2,612,000 | (est) |
| Justin Bartha | 2011 | $1,648,000 | $2,299,000 | (est) |
| Paul Giamatti | 2011 | $1,480,000 | $2,064,000 | (est) |
Aggregated Reviews
Rotten Tomatoes critic score35.0
RT critic review count246
Rotten Tomatoes audience score52.0
RT audience rating count100,000
IMDb rating6.5
IMDb votes563,389
Box Office ?
| Category | Year | Reported | Inflation Adjusted |
|---|---|---|---|
| Domestic | 2011 | $254,464,300 | $354,937,541 |
| International | 2011 | $332,300,000 | $463,506,059 |
| Worldwide | 2011 | $586,764,300 | $818,443,600 |
Earnings / Profitability
| Category | Year | Reported | Inflation Adjusted |
|---|---|---|---|
| Revenues | |||
| Theatrical Net Revenue | 2011 | $260,152,150 | $362,871,194 |
| Digital Rentals ? | 2011 | $5,697,000 | $7,946,416 |
| Digital Purchases ? | 2011 | $1,831,000 | $2,553,956 |
| Physical Rentals ? | 2011 | $10,425,000 | $14,541,230 |
| Physical Purchases ? | 2011 | $24,857,000 | $34,671,592 |
| TV & Streaming Revenue | 2011 | $71,250,004 | $99,382,511 |
| Total Revenues | 2011 | $374,212,154 | $521,966,900 |
| Expenses | |||
| Budget ? | 2011 | $80,000,000 | $111,587,375 |
| Print & Advertising (P&A) ? | 2011 | $81,725,000 (est) | $113,993,478 (est) |
| Participations | 2011 | $56,132,000 | $78,295,282 |
| Residuals ? | 2011 | $6,322,000 | $8,818,192 |
| Interest & Overhead | 2011 | $12,000,000 | $16,738,106 |
| Total Expenses | 2011 | $236,179,000 | $329,432,433 |
| Movie Net Profit or Loss | 2011 | $138,033,154 | $192,534,467 |
Similar Movies
| Poster | Movie | Year | Match | Overall | Est. Profit |
|---|---|---|---|---|---|
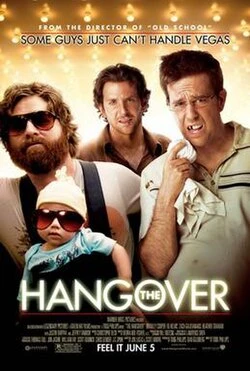 | The Hangover | 2009 | Shared franchise (1) | 95.0 | $221,130,241 |
 | 22 Jump Street | 2014 | Shared genres: 4 | 92.8 | $76,288,901 |
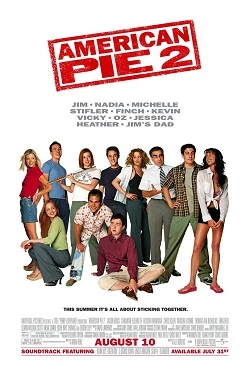 | American Pie 2 | 2001 | Shared genres: 4 | 87.7 | $139,099,808 |
 | Jackass Number Two | 2006 | Shared genres: 4 | 84.9 | $81,865,613 |
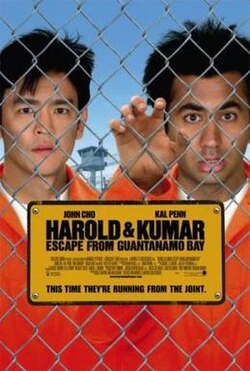 | Harold & Kumar Escape from Guantanamo Bay | 2008 | Shared genres: 4 | 82.2 | $36,867,410 |