Synopsis
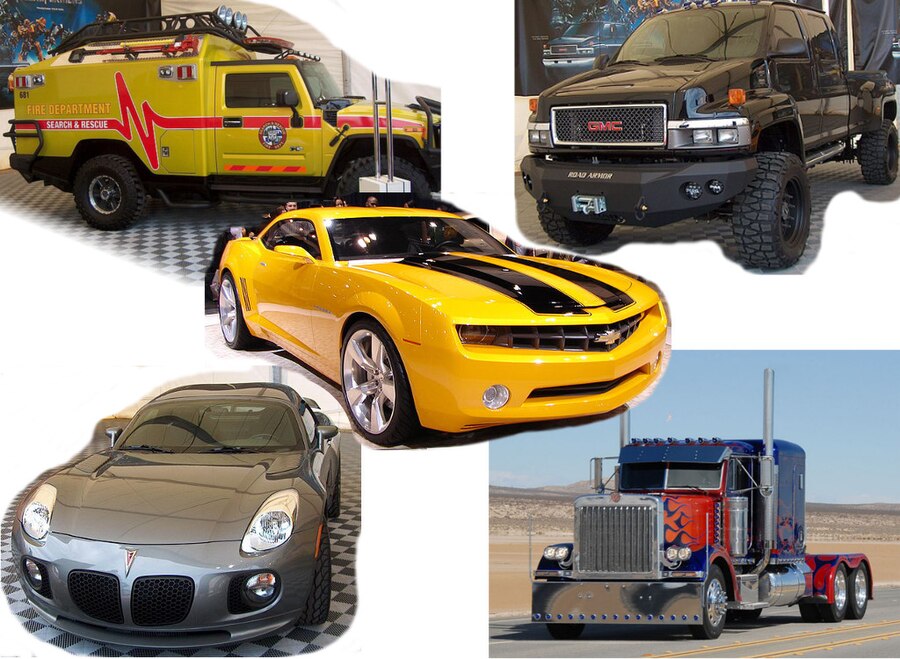
The Autobots must stop a colossal planet-consuming robot who goes after the Autobot Matrix of Leadership. At the same time, they must defend themselves against an all-out attack from the Decepticons.
Scores
Overall Score
66.4
Popularity Percentile (Year)
79.7%
Box Office Percentile (Year)
45.3%
Review Aggregate
73.6
Critic Consensus
Critic reception is mixed, with 62% of 21 logged reviews marked Fresh. Across reviews, critics repeatedly emphasize visually striking, lighthearted, family-friendly. Common reservations focus on execution consistency, even when reviewers praise standout elements.
visually strikinglightheartedfamily-friendlyaction-packedcharacter-drivenemotional
Cast
| Cast | Year | Reported Salary | Inflation Adjusted | Notes |
|---|---|---|---|---|
| Eric Idle | 1986 | $313,000 | $896,000 | (est) |
| Judd Nelson | 1986 | $193,000 | $551,000 | (est) |
| Leonard Nimoy | 1986 | $145,000 | $415,000 | (est) |
| Robert Stack | 1986 | $119,000 | $339,000 | (est) |
| Lionel Stander | 1986 | $101,000 | $290,000 | (est) |
| Orson Welles | 1986 | $89,000 | $256,000 | (est) |
Aggregated Reviews
Rotten Tomatoes critic score62.0
RT critic review count26
Rotten Tomatoes audience score88.0
RT audience rating count50,000
IMDb rating7.2
IMDb votes43,949
Box Office ?
| Category | Year | Reported | Inflation Adjusted |
|---|---|---|---|
| Domestic | 1986 | $5,849,647 | $16,743,013 |
| International | 1986 | N/A | N/A |
| Worldwide | 1986 | $5,849,647 | $16,743,013 |
Earnings / Profitability
| Category | Year | Reported | Inflation Adjusted |
|---|---|---|---|
| Revenues | |||
| Theatrical Net Revenue | 1986 | $2,924,824 | $8,371,507 |
| Digital Rentals ? | 1986 | N/A | N/A |
| Digital Purchases ? | 1986 | N/A | N/A |
| Physical Rentals ? | 1986 | $11,892,000 | $34,037,595 |
| Physical Purchases ? | 1986 | $5,106,000 | $14,614,527 |
| TV & Streaming Revenue | 1986 | $1,403,915 | $4,018,323 |
| Total Revenues | 1986 | $21,326,739 | $61,041,952 |
| Expenses | |||
| Budget ? | 1986 | $6,000,000 | $17,173,358 |
| Print & Advertising (P&A) ? | 1986 | $2,569,000 (est) | $7,353,059 (est) |
| Participations | 1986 | $853,000 | $2,441,479 |
| Residuals ? | 1986 | $1,316,000 | $3,766,690 |
| Interest & Overhead | 1986 | $1,200,000 | $3,434,672 |
| Total Expenses | 1986 | $11,938,000 | $34,169,257 |
| Movie Net Profit or Loss | 1986 | $9,388,739 | $26,872,695 |
Similar Movies
| Poster | Movie | Year | Match | Overall | Est. Profit |
|---|---|---|---|---|---|
 | Transformers | 2007 | Shared franchise (1) | 93.5 | $112,857,699 |
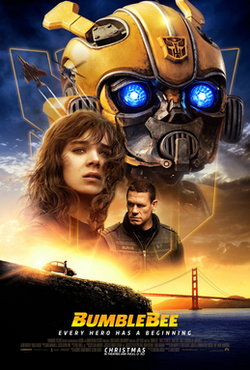 | Bumblebee | 2018 | Shared franchise (1) | 93.0 | $-10,482,818 |
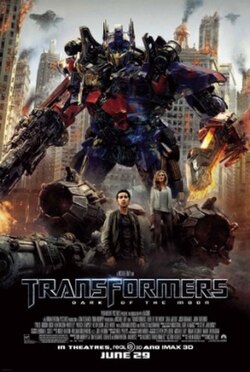 | Transformers: Dark of the Moon | 2011 | Shared franchise (1) | 88.9 | $181,683,376 |
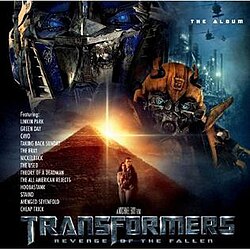 | Transformers: Revenge of the Fallen | 2009 | Shared franchise (1) | 87.0 | $102,560,819 |
 | Transformers: Age of Extinction | 2014 | Shared franchise (1) | 85.7 | $122,859,478 |