Synopsis
Bilbo Baggins and company are forced to engage in a war against an array of combatants and keep the Lonely Mountain from falling into the hands of a rising darkness.
Scores
Overall Score
92.8
Popularity Percentile (Year)
98.3%
Box Office Percentile (Year)
99.8%
Review Aggregate
68.0
Critic Consensus
Critic reception is mixed, with 59% of 265 logged reviews marked Fresh. Across reviews, critics repeatedly emphasize thin plot, visually striking, emotional. Common reservations focus on thin plot, even when reviewers praise standout elements.
thin plotvisually strikingemotionalgrittycharacter-drivenrealisticaction-packeddarkstylizedfunny
Cast
| Cast | Year | Reported Salary | Inflation Adjusted | Notes |
|---|---|---|---|---|
| Ian McKellen | 2014 | $22,546,000 | $29,881,000 | (est) |
| Martin Freeman | 2014 | $13,879,000 | $18,394,000 | (est) |
| Richard Armitage | 2014 | $10,449,000 | $13,849,000 | (est) |
| Evangeline Lilly | 2014 | $8,543,000 | $11,323,000 | (est) |
| Lee Pace | 2014 | $7,308,000 | $9,685,000 | (est) |
| Luke Evans | 2014 | $6,432,000 | $8,525,000 | (est) |
| Benedict Cumberbatch | 2014 | $5,774,000 | $7,653,000 | (est) |
| Ken Stott | 2014 | $5,259,000 | $6,970,000 | (est) |
| James Nesbitt | 2014 | $4,843,000 | $6,418,000 | (est) |
| Cate Blanchett | 2014 | $4,499,000 | $5,962,000 | (est) |
| Ian Holm | 2014 | $4,208,000 | $5,577,000 | (est) |
| Christopher Lee | 2014 | $3,960,000 | $5,248,000 | (est) |
| Hugo Weaving | 2014 | $3,744,000 | $4,962,000 | (est) |
| Orlando Bloom | 2014 | $3,555,000 | $4,711,000 | (est) |
Aggregated Reviews
Rotten Tomatoes critic score59.0
RT critic review count265
Rotten Tomatoes audience score74.0
RT audience rating count100,000
IMDb rating7.4
IMDb votes603,807
Box Office ?
| Category | Year | Reported | Inflation Adjusted |
|---|---|---|---|
| Domestic | 2014 | $255,119,788 | $338,111,861 |
| International | 2014 | $700,900,000 | $928,907,182 |
| Worldwide | 2014 | $956,019,788 | $1,267,019,043 |
Earnings / Profitability
| Category | Year | Reported | Inflation Adjusted |
|---|---|---|---|
| Revenues | |||
| Theatrical Net Revenue | 2014 | $407,919,894 | $540,618,803 |
| Digital Rentals ? | 2014 | $5,229,000 | $6,930,027 |
| Digital Purchases ? | 2014 | $4,142,000 | $5,489,419 |
| Physical Rentals ? | 2014 | $5,961,000 | $7,900,151 |
| Physical Purchases ? | 2014 | $16,067,000 | $21,293,696 |
| TV & Streaming Revenue | 2014 | $71,433,541 | $94,671,321 |
| Total Revenues | 2014 | $510,752,435 | $676,903,417 |
| Expenses | |||
| Budget ? | 2014 | $300,000,000 | $397,591,888 |
| Print & Advertising (P&A) ? | 2014 | $136,473,000 (est) | $180,868,526 (est) |
| Participations | 2014 | $40,860,000 | $54,152,015 |
| Residuals ? | 2014 | $5,361,000 | $7,104,967 |
| Interest & Overhead | 2014 | $36,000,000 | $47,711,027 |
| Total Expenses | 2014 | $518,694,000 | $687,428,423 |
| Movie Net Profit or Loss | 2014 | $-7,941,565 | $-10,525,007 |
Similar Movies
| Poster | Movie | Year | Match | Overall | Est. Profit |
|---|---|---|---|---|---|
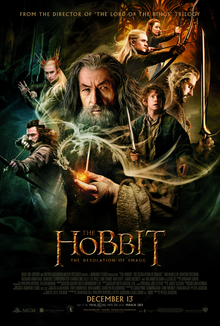 | The Hobbit: The Desolation of Smaug | 2013 | Shared franchise (2) | 95.0 | $34,467,147 |
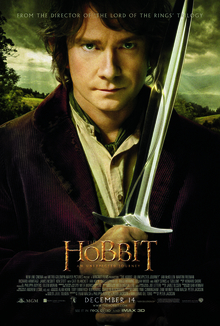 | The Hobbit: An Unexpected Journey | 2012 | Shared franchise (2) | 94.3 | $28,272,033 |
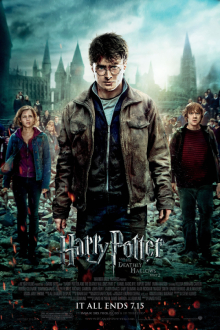 | Harry Potter and the Deathly Hallows: Part 2 | 2011 | Shared genres: 8 | 97.9 | $199,533,536 |
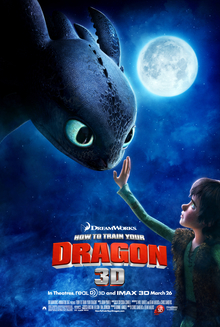 | How to Train Your Dragon | 2010 | Shared genres: 8 | 97.3 | $3,305,371 |
 | How to Train Your Dragon 2 | 2014 | Shared genres: 8 | 95.1 | $48,707,119 |