Synopsis
A retired spy is called back into action, and to bond with her new step-children, she invites them along for the adventure to stop the evil Timekeeper from taking over the world.
Scores
Overall Score
66.9
Popularity Percentile (Year)
67.6%
Box Office Percentile (Year)
86.7%
Review Aggregate
30.8
Critic Consensus
Critic reception is largely negative, with 23% of 60 logged reviews marked Fresh. Across reviews, critics repeatedly emphasize family-friendly, thin plot, coming of age. Many reviews cite thin plot as the main reasons it falls short.
family-friendlythin plotcoming of agefunnyvisually strikingemotionallighthearted
Cast
| Cast | Year | Reported Salary | Inflation Adjusted | Notes |
|---|---|---|---|---|
| Jessica Alba | 2011 | $1,518,000 | $2,118,000 | (est) |
| Joel McHale | 2011 | $935,000 | $1,304,000 | (est) |
| Alexa Vega | 2011 | $704,000 | $981,000 | (est) |
| Daryl Sabara | 2011 | $575,000 | $802,000 | (est) |
| Rowan Blanchard | 2011 | $492,000 | $686,000 | (est) |
| Mason Cook | 2011 | $433,000 | $604,000 | (est) |
| Ricky Gervais | 2011 | $389,000 | $542,000 | (est) |
| Jeremy Piven | 2011 | $354,000 | $494,000 | (est) |
Aggregated Reviews
Rotten Tomatoes critic score23.0
RT critic review count60
Rotten Tomatoes audience score36.0
RT audience rating count25,000
IMDb rating3.6
IMDb votes29,957
Box Office ?
| Category | Year | Reported | Inflation Adjusted |
|---|---|---|---|
| Domestic | 2011 | $38,538,188 | $53,754,688 |
| International | 2011 | $47,026,120 | $65,594,013 |
| Worldwide | 2011 | $85,564,310 | $119,348,704 |
Earnings / Profitability
| Category | Year | Reported | Inflation Adjusted |
|---|---|---|---|
| Revenues | |||
| Theatrical Net Revenue | 2011 | $38,079,542 | $53,114,949 |
| Digital Rentals ? | 2011 | $4,347,000 | $6,063,379 |
| Digital Purchases ? | 2011 | $1,397,000 | $1,948,594 |
| Physical Rentals ? | 2011 | $7,954,000 | $11,094,574 |
| Physical Purchases ? | 2011 | $18,966,000 | $26,454,576 |
| TV & Streaming Revenue | 2011 | $9,634,547 | $13,438,672 |
| Total Revenues | 2011 | $80,378,089 | $112,114,744 |
| Expenses | |||
| Budget ? | 2011 | $27,000,000 | $37,660,737 |
| Print & Advertising (P&A) ? | 2011 | $27,411,000 (est) | $38,234,017 (est) |
| Participations | 2011 | $3,215,000 | $4,484,417 |
| Residuals ? | 2011 | $2,674,000 | $3,729,808 |
| Interest & Overhead | 2011 | $4,590,000 | $6,402,325 |
| Total Expenses | 2011 | $64,890,000 | $90,511,306 |
| Movie Net Profit or Loss | 2011 | $15,488,089 | $21,603,439 |
Similar Movies
| Poster | Movie | Year | Match | Overall | Est. Profit |
|---|---|---|---|---|---|
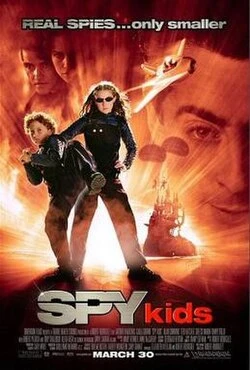 | Spy Kids | 2001 | Shared franchise (1) | 85.3 | $73,828,892 |
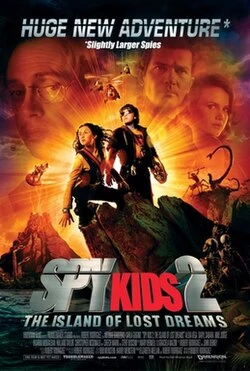 | Spy Kids 2: Island of Lost Dreams | 2002 | Shared franchise (1) | 80.7 | $47,550,594 |
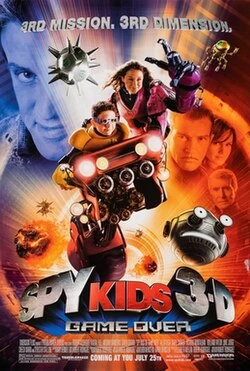 | Spy Kids 3: Game Over | 2003 | Shared franchise (1) | 77.2 | $81,265,348 |
 | Rise of the Guardians | 2012 | Shared genres: 8 | 90.1 | $-100,877,866 |
 | Pan | 2015 | Shared genres: 8 | 79.4 | $-138,875,760 |