Synopsis
Tim Avery, an aspiring cartoonist, finds himself in a predicament when his dog stumbles upon the mask of Loki. Then after conceiving an infant son "born of the mask", he discovers just how looney child raising can be.
Scores
Overall Score
63.4
Popularity Percentile (Year)
69.0%
Box Office Percentile (Year)
84.6%
Review Aggregate
13.8
Critic Consensus
Critic reception is largely negative, with 6% of 99 logged reviews marked Fresh. Across reviews, critics repeatedly emphasize thin plot, family-friendly, visually striking. Many reviews cite pacing issues, thin plot as the main reasons it falls short.
thin plotfamily-friendlyvisually strikingstylizedfunnycoming of agemacabrepacing issuessatiricalsuspenseful
Cast
| Cast | Year | Reported Salary | Inflation Adjusted | Notes |
|---|---|---|---|---|
| Jamie Kennedy | 2005 | $6,572,000 | $10,557,000 | (est) |
| Alan Cumming | 2005 | $4,046,000 | $6,498,000 | (est) |
| Traylor Howard | 2005 | $3,046,000 | $4,893,000 | (est) |
| Steven Wright | 2005 | $2,490,000 | $4,000,000 | (est) |
| Kal Penn | 2005 | $2,130,000 | $3,422,000 | (est) |
| Bob Hoskins | 2005 | $1,875,000 | $3,012,000 | (est) |
Aggregated Reviews
Rotten Tomatoes critic score6.0
RT critic review count102
Rotten Tomatoes audience score16.0
RT audience rating count25,000
IMDb rating2.3
IMDb votes61,511
Box Office ?
| Category | Year | Reported | Inflation Adjusted |
|---|---|---|---|
| Domestic | 2005 | $17,018,422 | $27,335,786 |
| International | 2005 | $42,963,128 | $69,009,387 |
| Worldwide | 2005 | $59,981,548 | $96,345,170 |
Earnings / Profitability
| Category | Year | Reported | Inflation Adjusted |
|---|---|---|---|
| Revenues | |||
| Theatrical Net Revenue | 2005 | $25,694,462 | $41,271,648 |
| Digital Rentals ? | 2005 | $251,000 | $403,168 |
| Digital Purchases ? | 2005 | $39,000 | $62,644 |
| Physical Rentals ? | 2005 | $14,020,000 | $22,519,580 |
| Physical Purchases ? | 2005 | $33,657,000 | $54,061,449 |
| TV & Streaming Revenue | 2005 | $4,084,421 | $6,560,589 |
| Total Revenues | 2005 | $77,745,883 | $124,879,077 |
| Expenses | |||
| Budget ? | 2005 | $84,000,000 | $134,924,732 |
| Print & Advertising (P&A) ? | 2005 | $15,933,000 (est) | $25,592,330 (est) |
| Participations | 2005 | $1,555,000 | $2,497,714 |
| Residuals ? | 2005 | $3,728,000 | $5,988,088 |
| Interest & Overhead | 2005 | $12,600,000 | $20,238,710 |
| Total Expenses | 2005 | $117,816,000 | $189,241,574 |
| Movie Net Profit or Loss | 2005 | $-40,070,117 | $-64,362,497 |
Similar Movies
| Poster | Movie | Year | Match | Overall | Est. Profit |
|---|---|---|---|---|---|
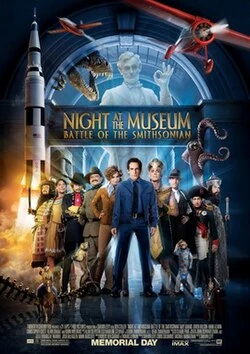 | Night at the Museum: Battle of the Smithsonian | 2009 | Shared genres: 4 | 85.8 | $8,309,089 |
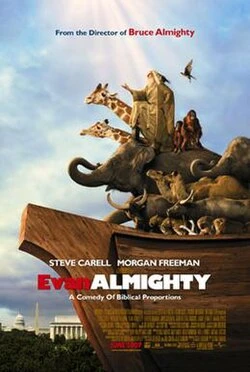 | Evan Almighty | 2007 | Shared genres: 4 | 82.8 | $-115,347,040 |
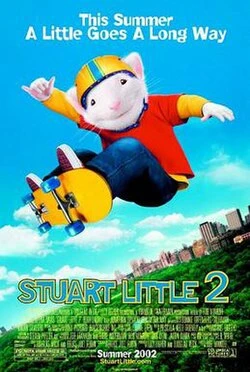 | Stuart Little 2 | 2002 | Shared genres: 4 | 81.5 | $-39,027,394 |
 | A Dog's Journey | 2019 | Shared genres: 4 | 81.3 | $13,803,370 |
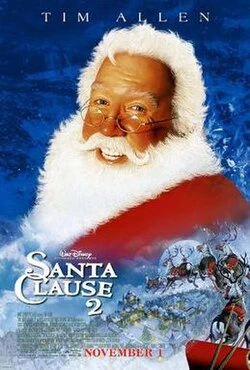 | The Santa Clause 2 | 2002 | Shared genres: 4 | 80.2 | $55,496,824 |