Synopsis
A magic board game summons jungle perils and a missing boy.
Scores
Overall Score
89.7
Popularity Percentile (Year)
97.1%
Box Office Percentile (Year)
96.7%
Review Aggregate
61.0
Critic Consensus
Critic reception is mixed, with 62% of 32 logged reviews marked Fresh. Across reviews, critics repeatedly emphasize scary, funny, family-friendly. Common reservations focus on execution consistency, even when reviewers praise standout elements.
scaryfunnyfamily-friendlyvisually strikingaction-packedlightheartedstylizedsuspensefulemotionalchristmas
Cast
| Cast | Year | Reported Salary | Inflation Adjusted | Notes |
|---|---|---|---|---|
| Robin Williams | 1995 | $15,000,000 source | $30,875,986 | reported |
| Kirsten Dunst | 1995 | $3,131,000 | $6,444,000 | (est) |
| David Alan Grier | 1995 | $2,357,000 | $4,852,000 | (est) |
| Bonnie Hunt | 1995 | $1,927,000 | $3,967,000 | (est) |
| Jonathan Hyde | 1995 | $1,648,000 | $3,393,000 | (est) |
| Bebe Neuwirth | 1995 | $1,451,000 | $2,987,000 | (est) |
Aggregated Reviews
Rotten Tomatoes critic score53.0
RT critic review count49
Rotten Tomatoes audience score63.0
RT audience rating count250,000
IMDb rating7.1
IMDb votes401,665
Box Office ?
| Category | Year | Reported | Inflation Adjusted |
|---|---|---|---|
| Domestic | 1995 | $100,475,250 | $206,818,158 |
| International | 1995 | N/A | N/A |
| Worldwide | 1995 | $100,476,480 | $206,820,690 |
Earnings / Profitability
| Category | Year | Reported | Inflation Adjusted |
|---|---|---|---|
| Revenues | |||
| Theatrical Net Revenue | 1995 | $50,237,625 | $103,409,079 |
| Digital Rentals ? | 1995 | N/A | N/A |
| Digital Purchases ? | 1995 | N/A | N/A |
| Physical Rentals ? | 1995 | $51,218,000 | $105,427,082 |
| Physical Purchases ? | 1995 | $52,768,000 | $108,617,601 |
| TV & Streaming Revenue | 1995 | $28,133,070 | $57,909,084 |
| Total Revenues | 1995 | $182,356,695 | $375,362,846 |
| Expenses | |||
| Budget ? | 1995 | $65,000,000 | $133,795,938 |
| Print & Advertising (P&A) ? | 1995 | $19,725,000 (est) | $40,601,921 (est) |
| Participations | 1995 | $14,589,000 | $30,029,984 |
| Residuals ? | 1995 | $9,036,000 | $18,599,694 |
| Interest & Overhead | 1995 | $9,750,000 | $20,069,391 |
| Total Expenses | 1995 | $118,100,000 | $243,096,927 |
| Movie Net Profit or Loss | 1995 | $64,256,695 | $132,265,919 |
Similar Movies
| Poster | Movie | Year | Match | Overall | Est. Profit |
|---|---|---|---|---|---|
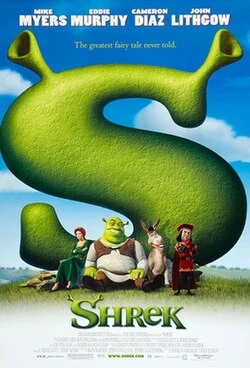 | Shrek | 2001 | Shared genres: 8 | 95.9 | $196,186,888 |
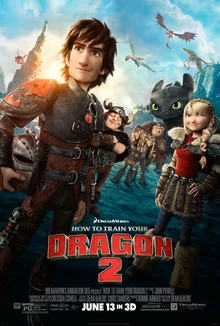 | How to Train Your Dragon 2 | 2014 | Shared genres: 8 | 95.1 | $48,707,125 |
 | Rise of the Guardians | 2012 | Shared genres: 8 | 90.1 | $-100,877,866 |
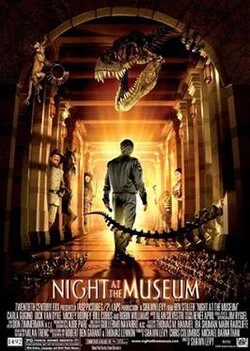 | Night at the Museum | 2006 | Shared genres: 8 | 89.7 | $134,277,371 |
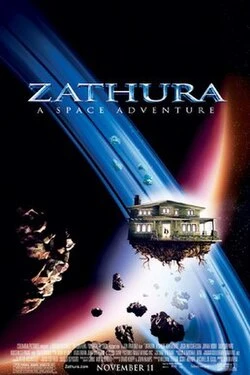 | Zathura: A Space Adventure | 2005 | Shared genres: 8 | 83.8 | $-7,279,755 |