Synopsis
A man fighting in a war against aliens must relive the same day every time he dies until he can find a way to stop their power source with the help of an elite soldier.
Scores
Overall Score
96.0
Popularity Percentile (Year)
98.8%
Box Office Percentile (Year)
97.3%
Review Aggregate
87.7
Critic Consensus
Critic reception is largely positive, with 91% of 337 logged reviews marked Fresh. Across reviews, critics repeatedly emphasize funny, character-driven, visually striking. Most critics frame the film as an effective delivery of its core style and intent.
funnycharacter-drivenvisually strikingstylizedaction-packedsuspensefulromanticdarklightheartedcoming of age
Cast
| Cast | Year | Reported Salary | Inflation Adjusted | Notes |
|---|---|---|---|---|
| Tom Cruise | 2014 | $21,725,000 | $28,793,000 | (est) |
| Emily Blunt | 2014 | $13,373,000 | $17,724,000 | (est) |
| Bill Paxton | 2014 | $10,069,000 | $13,344,000 | (est) |
| Brendan Gleeson | 2014 | $8,232,000 | $10,910,000 | (est) |
Aggregated Reviews
Rotten Tomatoes critic score91.0
RT critic review count337
Rotten Tomatoes audience score90.0
RT audience rating count100,000
IMDb rating7.9
IMDb votes784,289
Box Office ?
| Category | Year | Reported | Inflation Adjusted |
|---|---|---|---|
| Domestic | 2014 | $100,206,256 | $132,803,987 |
| International | 2014 | $270,335,000 | $358,276,691 |
| Worldwide | 2014 | $370,541,250 | $491,080,670 |
Earnings / Profitability
| Category | Year | Reported | Inflation Adjusted |
|---|---|---|---|
| Revenues | |||
| Theatrical Net Revenue | 2014 | $158,237,128 | $209,712,670 |
| Digital Rentals ? | 2014 | $4,999,000 | $6,625,206 |
| Digital Purchases ? | 2014 | $3,959,000 | $5,246,888 |
| Physical Rentals ? | 2014 | $5,698,000 | $7,551,596 |
| Physical Purchases ? | 2014 | $15,360,000 | $20,356,705 |
| TV & Streaming Revenue | 2014 | $25,051,564 | $33,200,997 |
| Total Revenues | 2014 | $213,304,692 | $282,694,062 |
| Expenses | |||
| Budget ? | 2014 | $178,000,000 | $235,904,530 |
| Print & Advertising (P&A) ? source | 2014 | $100,000,000 | $132,530,635 |
| Participations | 2014 | $4,266,000 | $5,653,757 |
| Residuals ? | 2014 | $3,049,000 | $4,040,859 |
| Interest & Overhead | 2014 | $21,360,000 | $28,308,544 |
| Total Expenses | 2014 | $306,675,000 | $406,438,324 |
| Movie Net Profit or Loss | 2014 | $-93,370,308 | $-123,744,262 |
Similar Movies
| Poster | Movie | Year | Match | Overall | Est. Profit |
|---|---|---|---|---|---|
 | Avengers: Endgame | 2019 | Shared genres: 8 | 97.9 | $685,779,490 |
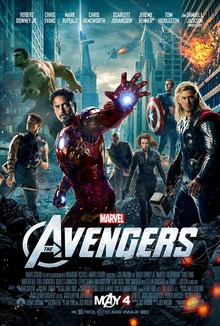 | The Avengers | 2012 | Shared genres: 8 | 97.4 | $362,859,255 |
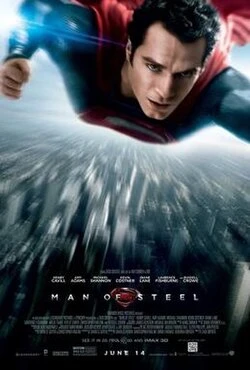 | Man of Steel | 2013 | Shared genres: 8 | 92.7 | $-10,807,510 |
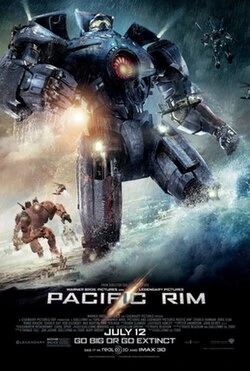 | Pacific Rim | 2013 | Shared genres: 8 | 92.3 | $-104,130,822 |
 | Captain Marvel | 2019 | Shared genres: 8 | 92.2 | $225,642,307 |