Synopsis
Political involvement in the Avengers' affairs causes a rift between Captain America and Iron Man.
Scores
Overall Score
97.2
Popularity Percentile (Year)
99.8%
Box Office Percentile (Year)
99.9%
Review Aggregate
86.7
Critic Consensus
Critic reception is largely positive, with 90% of 429 logged reviews marked Fresh. Across reviews, critics repeatedly emphasize thin plot, emotional, funny. Most critics frame the film as an effective delivery of its core style and intent.
thin plotemotionalfunnydarkaction-packedvisually strikingsuspensefulpoliticalgrittythought-provoking
Cast
| Cast | Year | Reported Salary | Inflation Adjusted | Notes |
|---|---|---|---|---|
| Chris Evans | 2016 | $15,000,000 source | $19,606,249 | reported |
| Robert Downey Jr. | 2016 | $10,317,000 | $13,485,000 | (est) |
| Scarlett Johansson | 2016 | $15,000,000 source | $19,606,249 | reported |
| Sebastian Stan | 2016 | $6,351,000 | $8,301,000 | (est) |
| Anthony Mackie | 2016 | $5,432,000 | $7,101,000 | (est) |
| Don Cheadle | 2016 | $6,000,000 source | $7,842,500 | reported |
| Jeremy Renner | 2016 | $4,292,000 | $5,611,000 | (est) |
| Chadwick Boseman | 2016 | $700,000 source | $914,958 | reported |
| Paul Bettany | 2016 | $3,600,000 | $4,706,000 | (est) |
| Elizabeth Olsen | 2016 | $3,344,000 | $4,371,000 | (est) |
| Paul Rudd | 2016 | $3,128,000 | $4,089,000 | (est) |
| Emily VanCamp | 2016 | $2,943,000 | $3,847,000 | (est) |
| Marisa Tomei | 2016 | $2,783,000 | $3,638,000 | (est) |
| Tom Holland | 2016 | $250,000 source | $326,771 | reported |
| Frank Grillo | 2016 | $2,518,000 | $3,291,000 | (est) |
| Martin Freeman | 2016 | $2,407,000 | $3,146,000 | (est) |
| William Hurt | 2016 | $2,307,000 | $3,015,000 | (est) |
| Daniel Brühl | 2016 | $2,216,000 | $2,897,000 | (est) |
Aggregated Reviews
Rotten Tomatoes critic score90.0
RT critic review count430
Rotten Tomatoes audience score89.0
RT audience rating count100,000
IMDb rating7.8
IMDb votes902,843
Box Office ?
| Category | Year | Reported | Inflation Adjusted |
|---|---|---|---|
| Domestic | 2016 | $408,084,350 | $533,400,227 |
| International | 2016 | $745,211,970 | $974,054,099 |
| Worldwide | 2016 | $1,153,296,300 | $1,507,454,300 |
Earnings / Profitability
| Category | Year | Reported | Inflation Adjusted |
|---|---|---|---|
| Revenues | |||
| Theatrical Net Revenue | 2016 | $502,126,963 | $656,321,753 |
| Digital Rentals ? | 2016 | $5,074,000 | $6,632,141 |
| Digital Purchases ? | 2016 | $5,172,000 | $6,760,235 |
| Physical Rentals ? | 2016 | $4,454,000 | $5,821,749 |
| Physical Purchases ? | 2016 | $12,570,000 | $16,430,037 |
| TV & Streaming Revenue | 2016 | $142,829,522 | $186,690,079 |
| Total Revenues | 2016 | $672,226,486 | $878,655,993 |
| Expenses | |||
| Budget ? | 2016 | $250,000,000 | $326,770,818 |
| Print & Advertising (P&A) ? source | 2016 | $200,000,000 | $261,416,654 |
| Participations | 2016 | $100,834,000 | $131,798,435 |
| Residuals ? | 2016 | $8,425,000 | $11,012,177 |
| Interest & Overhead | 2016 | $30,000,000 | $39,212,498 |
| Total Expenses | 2016 | $589,259,000 | $770,210,581 |
| Movie Net Profit or Loss | 2016 | $82,967,486 | $108,445,412 |
Similar Movies
| Poster | Movie | Year | Match | Overall | Est. Profit |
|---|---|---|---|---|---|
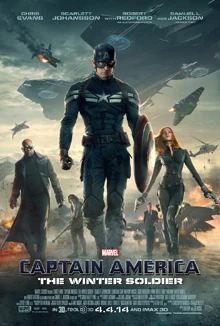 | Captain America: The Winter Soldier | 2014 | Shared franchise (2) | 96.9 | $43,188,908 |
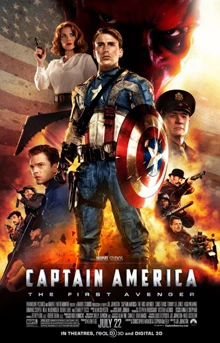 | Captain America: The First Avenger | 2011 | Shared franchise (2) | 93.9 | $-32,974,378 |
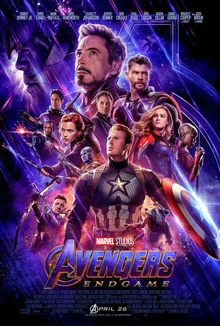 | Avengers: Endgame | 2019 | Shared franchise (1) | 97.9 | $685,779,490 |
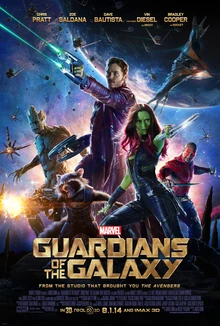 | Guardians of the Galaxy | 2014 | Shared franchise (1) | 97.6 | $72,200,110 |
 | The Avengers | 2012 | Shared franchise (1) | 97.4 | $362,859,255 |