Synopsis
After the Bergens invade Troll Village, Poppy, the happiest Troll ever born, and the curmudgeonly Branch set off on a journey to rescue her friends.
Scores
Overall Score
86.9
Popularity Percentile (Year)
86.8%
Box Office Percentile (Year)
96.7%
Review Aggregate
69.8
Critic Consensus
Critic reception is largely positive, with 76% of 161 logged reviews marked Fresh. Across reviews, critics repeatedly emphasize family-friendly, funny, lighthearted. Most critics frame the film as an effective delivery of its core style and intent.
family-friendlyfunnylightheartedvisually strikingcharacter-drivenemotionalstylizedupliftinghistoricalscary
Cast
| Cast | Year | Reported Salary | Inflation Adjusted | Notes |
|---|---|---|---|---|
| Anna Kendrick | 2016 | $12,225,000 | $15,980,000 | (est) |
| Justin Timberlake | 2016 | $7,526,000 | $9,837,000 | (est) |
| Zooey Deschanel | 2016 | $5,666,000 | $7,406,000 | (est) |
| Russell Brand | 2016 | $4,633,000 | $6,055,000 | (est) |
| James Corden | 2016 | $3,963,000 | $5,179,000 | (est) |
| Gwen Stefani | 2016 | $3,488,000 | $4,559,000 | (est) |
Aggregated Reviews
Rotten Tomatoes critic score76.0
RT critic review count161
Rotten Tomatoes audience score67.0
RT audience rating count25,000
IMDb rating6.4
IMDb votes98,166
Box Office ?
| Category | Year | Reported | Inflation Adjusted |
|---|---|---|---|
| Domestic | 2016 | $153,856,089 | $201,102,730 |
| International | 2016 | $193,157,398 | $252,472,816 |
| Worldwide | 2016 | $347,013,487 | $453,575,545 |
Earnings / Profitability
| Category | Year | Reported | Inflation Adjusted |
|---|---|---|---|
| Revenues | |||
| Theatrical Net Revenue | 2016 | $154,191,004 | $201,540,491 |
| Digital Rentals ? | 2016 | $4,734,000 | $6,187,732 |
| Digital Purchases ? | 2016 | $4,825,000 | $6,306,677 |
| Physical Rentals ? | 2016 | $4,155,000 | $5,430,931 |
| Physical Purchases ? | 2016 | $11,727,000 | $15,328,166 |
| TV & Streaming Revenue | 2016 | $43,079,705 | $56,308,764 |
| Total Revenues | 2016 | $222,711,709 | $291,102,762 |
| Expenses | |||
| Budget ? | 2016 | $125,000,000 | $163,385,417 |
| Print & Advertising (P&A) ? source | 2016 | $105,000,000 | $137,243,750 |
| Participations | 2016 | $4,454,000 | $5,821,749 |
| Residuals ? | 2016 | $3,531,000 | $4,615,311 |
| Interest & Overhead | 2016 | $15,000,000 | $19,606,250 |
| Total Expenses | 2016 | $252,985,000 | $330,672,477 |
| Movie Net Profit or Loss | 2016 | $-30,273,291 | $-39,569,715 |
Similar Movies
| Poster | Movie | Year | Match | Overall | Est. Profit |
|---|---|---|---|---|---|
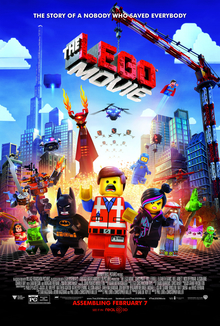 | The Lego Movie | 2014 | Shared genres: 8 | 95.0 | $154,543,340 |
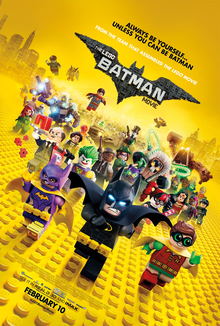 | The Lego Batman Movie | 2017 | Shared genres: 8 | 91.1 | $-84,350,700 |
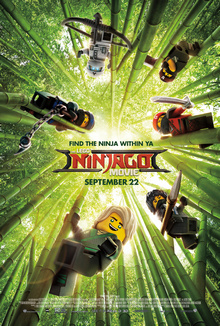 | The Lego Ninjago Movie | 2017 | Shared genres: 8 | 76.9 | $-51,550,834 |
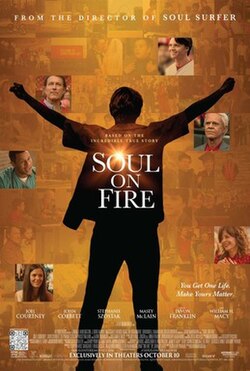 | Soul | 2024 | Shared genres: 8 | 74.7 | $-39,646,986 |
 | Trolls Band Together | 2023 | Shared franchise (1) | 80.0 | $-39,704,034 |