Synopsis
In 1971, twenty-four male students are selected to take on randomly assigned roles of prisoners and guards in a mock prison situated in the basement of the Stanford psychology building.
Scores
Overall Score
66.6
Popularity Percentile (Year)
78.1%
Box Office Percentile (Year)
45.9%
Review Aggregate
76.8
Critic Consensus
Critic reception is largely positive, with 84% of 101 logged reviews marked Fresh. Across reviews, critics repeatedly emphasize suspenseful, character-driven, historical. Most critics frame the film as an effective delivery of its core style and intent.
suspensefulcharacter-drivenhistoricalvisually strikingemotionalpsychologicalthought-provokingdarkrealisticmacabre
Cast
| Cast | Year | Reported Salary | Inflation Adjusted | Notes |
|---|---|---|---|---|
| Billy Crudup | 2015 | $8,000 | $10,000 | (est) |
| Michael Angarano | 2015 | $5,000 | $6,000 | (est) |
| Ezra Miller | 2015 | $4,000 | $5,000 | (est) |
| Tye Sheridan | 2015 | $3,000 | $4,000 | (est) |
| Olivia Thirlby | 2015 | $2,000 | $3,000 | (est) |
| Nelsan Ellis | 2015 | $2,000 | $3,000 | (est) |
Aggregated Reviews
Rotten Tomatoes critic score84.0
RT critic review count101
Rotten Tomatoes audience score75.0
RT audience rating count10,000
IMDb rating6.8
IMDb votes47,541
Box Office ?
| Category | Year | Reported | Inflation Adjusted |
|---|---|---|---|
| Domestic | 2015 | $660,561 | $874,337 |
| International | 2015 | $2,553 | $3,379 |
| Worldwide | 2015 | $663,114 | $877,717 |
Earnings / Profitability
| Category | Year | Reported | Inflation Adjusted |
|---|---|---|---|
| Revenues | |||
| Theatrical Net Revenue | 2015 | $331,302 | $438,520 |
| Digital Rentals ? | 2015 | $2,593,000 | $3,432,169 |
| Digital Purchases ? | 2015 | $2,719,000 | $3,598,946 |
| Physical Rentals ? | 2015 | $2,941,000 | $3,892,792 |
| Physical Purchases ? | 2015 | $7,882,000 | $10,432,841 |
| TV & Streaming Revenue | 2015 | $277,436 | $367,222 |
| Total Revenues | 2015 | $16,743,737 | $22,162,491 |
| Expenses | |||
| Budget ? | 2015 | $729,000 (est) | $964,925 (est) |
| Print & Advertising (P&A) ? | 2015 | $530,000 (est) | $701,523 (est) |
| Participations | 2015 | $670,000 | $886,831 |
| Residuals ? | 2015 | $969,000 | $1,282,596 |
| Interest & Overhead | 2015 | $145,800 | $192,985 |
| Total Expenses | 2015 | $3,043,800 | $4,028,861 |
| Movie Net Profit or Loss | 2015 | $13,699,937 | $18,133,630 |
Similar Movies
| Poster | Movie | Year | Match | Overall | Est. Profit |
|---|---|---|---|---|---|
 | Argo | 2012 | Shared genres: 4 | 94.9 | $60,917,890 |
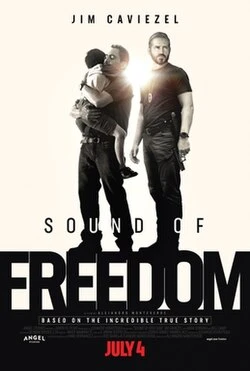 | Sound of Freedom | 2023 | Shared genres: 4 | 89.2 | $123,289,820 |
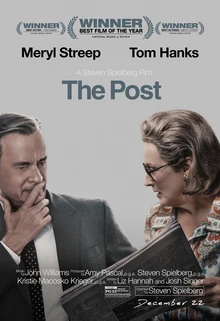 | The Post | 2017 | Shared genres: 4 | 89.0 | $15,600,992 |
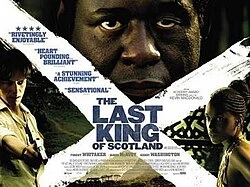 | The Last King of Scotland | 2006 | Shared genres: 4 | 88.0 | $49,495,549 |
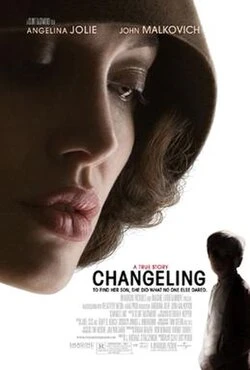 | Changeling | 2008 | Shared genres: 4 | 87.6 | $1,151,222 |