Synopsis
When a young boy accidentally triggers the universe's most lethal hunters' return to Earth, only a ragtag crew of ex-soldiers and a disgruntled scientist can prevent the end of the human race.
Scores
Overall Score
82.7
Popularity Percentile (Year)
93.5%
Box Office Percentile (Year)
94.3%
Review Aggregate
38.0
Critic Consensus
Critic reception is largely negative, with 34% of 296 logged reviews marked Fresh. Across reviews, critics repeatedly emphasize thin plot, funny, pacing issues. Many reviews cite pacing issues, thin plot as the main reasons it falls short.
thin plotfunnypacing issuesmacabrestylizedvisually strikingaction-packeduneven tonesuspensefulemotional
Cast
| Cast | Year | Reported Salary | Inflation Adjusted | Notes |
|---|---|---|---|---|
| Boyd Holbrook | 2018 | $5,600,000 | $6,996,000 | (est) |
| Olivia Munn | 2018 | $3,447,000 | $4,306,000 | (est) |
| Trevante Rhodes | 2018 | $2,595,000 | $3,242,000 | (est) |
| Keegan-Michael Key | 2018 | $2,122,000 | $2,651,000 | (est) |
| Sterling K. Brown | 2018 | $1,815,000 | $2,268,000 | (est) |
| Jacob Tremblay | 2018 | $1,598,000 | $1,996,000 | (est) |
| Yvonne Strahovski | 2018 | $1,434,000 | $1,792,000 | (est) |
| Alfie Allen | 2018 | $1,306,000 | $1,632,000 | (est) |
| Thomas Jane | 2018 | $1,203,000 | $1,503,000 | (est) |
Aggregated Reviews
Rotten Tomatoes critic score34.0
RT critic review count296
Rotten Tomatoes audience score32.0
RT audience rating count5,000
IMDb rating5.3
IMDb votes157,013
Box Office ?
| Category | Year | Reported | Inflation Adjusted |
|---|---|---|---|
| Domestic | 2018 | $51,024,708 | $63,745,326 |
| International | 2018 | $109,517,424 | $136,820,457 |
| Worldwide | 2018 | $160,542,130 | $200,565,780 |
Earnings / Profitability
| Category | Year | Reported | Inflation Adjusted |
|---|---|---|---|
| Revenues | |||
| Theatrical Net Revenue | 2018 | $69,319,324 | $86,600,846 |
| Digital Rentals ? | 2018 | $4,169,000 | $5,208,345 |
| Digital Purchases ? | 2018 | $5,026,000 | $6,278,997 |
| Physical Rentals ? | 2018 | $2,568,000 | $3,208,210 |
| Physical Purchases ? | 2018 | $7,284,000 | $9,099,924 |
| TV & Streaming Revenue | 2018 | $12,756,177 | $15,936,331 |
| Total Revenues | 2018 | $101,122,501 | $126,332,653 |
| Expenses | |||
| Budget ? | 2018 | $88,000,000 | $109,938,672 |
| Print & Advertising (P&A) ? | 2018 | $38,977,000 (est) | $48,694,087 (est) |
| Participations | 2018 | $2,022,000 | $2,526,091 |
| Residuals ? | 2018 | $1,605,000 | $2,005,131 |
| Interest & Overhead | 2018 | $13,200,000 | $16,490,801 |
| Total Expenses | 2018 | $143,804,000 | $179,654,782 |
| Movie Net Profit or Loss | 2018 | $-42,681,499 | $-53,322,129 |
Similar Movies
| Poster | Movie | Year | Match | Overall | Est. Profit |
|---|---|---|---|---|---|
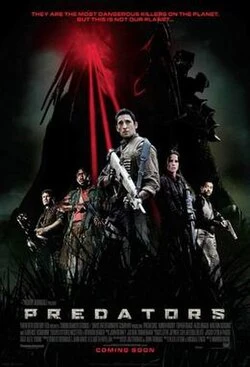 | Predators | 2010 | Shared franchise (1) | 84.5 | $23,366,482 |
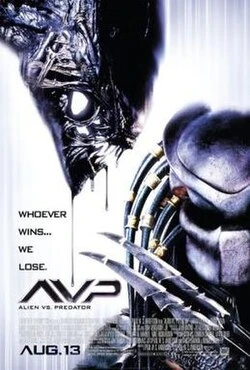 | Alien vs. Predator | 2004 | Shared franchise (1) | 82.0 | $42,918,615 |
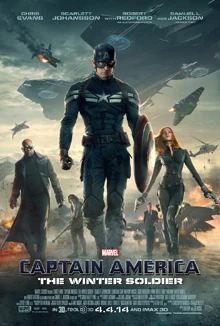 | Captain America: The Winter Soldier | 2014 | Shared genres: 7 | 96.9 | $43,188,908 |
 | Blade Runner 2049 | 2017 | Shared genres: 7 | 94.9 | $-108,074,380 |
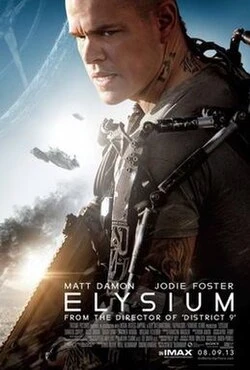 | Elysium | 2013 | Shared genres: 7 | 89.2 | $-55,926,178 |