Synopsis
The last witch hunter is all that stands between humanity and the combined forces of the most horrifying witches in history.
Scores
Overall Score
79.8
Popularity Percentile (Year)
88.1%
Box Office Percentile (Year)
93.2%
Review Aggregate
37.4
Critic Consensus
Critic reception is largely negative, with 18% of 137 logged reviews marked Fresh. Across reviews, critics repeatedly emphasize thin plot, funny, visually striking. Many reviews cite thin plot, uneven tone as the main reasons it falls short.
thin plotfunnyvisually strikinglightheartedromanticgrittyuneven tonecharacter-drivenfamily-friendlydark
Cast
| Cast | Year | Reported Salary | Inflation Adjusted | Notes |
|---|---|---|---|---|
| Vin Diesel | 2015 | $7,764,000 | $10,277,000 | (est) |
| Elijah Wood | 2015 | $4,779,000 | $6,326,000 | (est) |
| Rose Leslie | 2015 | $3,598,000 | $4,763,000 | (est) |
| Julie Engelbrecht | 2015 | $2,942,000 | $3,894,000 | (est) |
| Michael Caine | 2015 | $2,517,000 | $3,331,000 | (est) |
Aggregated Reviews
Rotten Tomatoes critic score18.0
RT critic review count137
Rotten Tomatoes audience score44.0
RT audience rating count25,000
IMDb rating5.9
IMDb votes114,583
Box Office ?
| Category | Year | Reported | Inflation Adjusted |
|---|---|---|---|
| Domestic | 2015 | $27,367,660 | $36,224,618 |
| International | 2015 | $119,569,250 | $158,265,282 |
| Worldwide | 2015 | $146,936,910 | $194,489,900 |
Earnings / Profitability
| Category | Year | Reported | Inflation Adjusted |
|---|---|---|---|
| Revenues | |||
| Theatrical Net Revenue | 2015 | $61,511,530 | $81,418,422 |
| Digital Rentals ? | 2015 | $3,889,000 | $5,147,592 |
| Digital Purchases ? | 2015 | $4,078,000 | $5,397,758 |
| Physical Rentals ? | 2015 | $4,412,000 | $5,839,849 |
| Physical Purchases ? | 2015 | $11,823,000 | $15,649,261 |
| TV & Streaming Revenue | 2015 | $6,568,238 | $8,693,908 |
| Total Revenues | 2015 | $92,281,768 | $122,146,790 |
| Expenses | |||
| Budget ? | 2015 | $90,000,000 | $119,126,576 |
| Print & Advertising (P&A) ? | 2015 | $38,750,000 (est) | $51,290,609 (est) |
| Participations | 2015 | $1,846,000 | $2,443,418 |
| Residuals ? | 2015 | $1,753,000 | $2,320,321 |
| Interest & Overhead | 2015 | $13,500,000 | $17,868,986 |
| Total Expenses | 2015 | $145,849,000 | $193,049,911 |
| Movie Net Profit or Loss | 2015 | $-53,567,232 | $-70,903,121 |
Similar Movies
| Poster | Movie | Year | Match | Overall | Est. Profit |
|---|---|---|---|---|---|
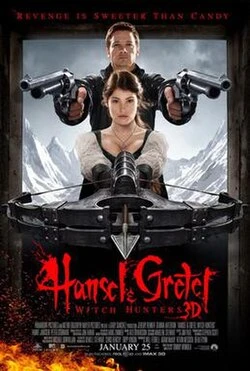 | Hansel & Gretel: Witch Hunters | 2013 | Shared genres: 5 | 82.1 | $12,255,115 |
 | Spider-Man: No Way Home | 2021 | Shared genres: 4 | 98.2 | $629,996,195 |
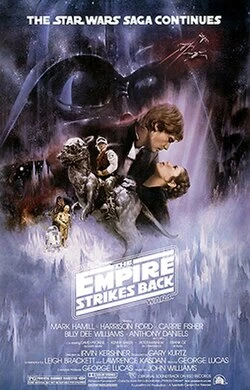 | Star Wars: Episode V - The Empire Strikes Back | 1980 | Shared genres: 4 | 98.0 | $118,938,326 |
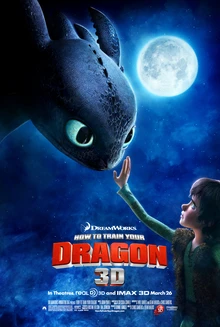 | How to Train Your Dragon | 2010 | Shared genres: 4 | 97.3 | $3,305,375 |
 | Star Wars: Episode VI - Return of the Jedi | 1983 | Shared genres: 4 | 97.1 | $138,915,285 |