Synopsis
Gene, a multi-expressional emoji, sets out on a journey to become a normal emoji.
Scores
Overall Score
76.4
Popularity Percentile (Year)
86.5%
Box Office Percentile (Year)
93.6%
Review Aggregate
23.8
Critic Consensus
Critic reception is largely negative, with 6% of 132 logged reviews marked Fresh. Across reviews, critics repeatedly emphasize thin plot, funny, family-friendly. Many reviews cite thin plot, uneven tone as the main reasons it falls short.
thin plotfunnyfamily-friendlycoming of agestylizedemotionaluneven tonedarkcharacter-drivenvisually striking
Cast
| Cast | Year | Reported Salary | Inflation Adjusted | Notes |
|---|---|---|---|---|
| T.J. Miller | 2017 | $2,886,000 | $3,694,000 | (est) |
| James Corden | 2017 | $1,777,000 | $2,274,000 | (est) |
| Anna Faris | 2017 | $1,338,000 | $1,712,000 | (est) |
| Maya Rudolph | 2017 | $1,094,000 | $1,400,000 | (est) |
| Steven Wright | 2017 | $936,000 | $1,197,000 | (est) |
| Jennifer Coolidge | 2017 | $823,000 | $1,054,000 | (est) |
| Jake T. Austin | 2017 | $739,000 | $946,000 | (est) |
| Christina Aguilera | 2017 | $673,000 | $862,000 | (est) |
| Sofia Vergara | 2017 | $620,000 | $793,000 | (est) |
| Sean Hayes | 2017 | $576,000 | $737,000 | (est) |
| Sir Patrick Stewart | 2017 | $539,000 | $689,000 | (est) |
Aggregated Reviews
Rotten Tomatoes critic score6.0
RT critic review count132
Rotten Tomatoes audience score36.0
RT audience rating count25,000
IMDb rating3.5
IMDb votes77,144
Box Office ?
| Category | Year | Reported | Inflation Adjusted |
|---|---|---|---|
| Domestic | 2017 | $86,089,513 | $110,184,742 |
| International | 2017 | $131,687,133 | $168,544,486 |
| Worldwide | 2017 | $217,776,646 | $278,729,228 |
Earnings / Profitability
| Category | Year | Reported | Inflation Adjusted |
|---|---|---|---|
| Revenues | |||
| Theatrical Net Revenue | 2017 | $95,719,610 | $122,510,165 |
| Digital Rentals ? | 2017 | $4,545,000 | $5,817,081 |
| Digital Purchases ? | 2017 | $5,072,000 | $6,491,581 |
| Physical Rentals ? | 2017 | $3,391,000 | $4,340,093 |
| Physical Purchases ? | 2017 | $9,738,000 | $12,463,528 |
| TV & Streaming Revenue | 2017 | $21,522,378 | $27,546,185 |
| Total Revenues | 2017 | $139,987,988 | $179,168,632 |
| Expenses | |||
| Budget ? | 2017 | $50,000,000 | $63,994,288 |
| Print & Advertising (P&A) ? | 2017 | $55,131,000 (est) | $70,561,382 (est) |
| Participations | 2017 | $11,199,000 | $14,333,441 |
| Residuals ? | 2017 | $2,287,000 | $2,927,099 |
| Interest & Overhead | 2017 | $7,500,000 | $9,599,143 |
| Total Expenses | 2017 | $126,117,000 | $161,415,353 |
| Movie Net Profit or Loss | 2017 | $13,870,988 | $17,753,280 |
Similar Movies
| Poster | Movie | Year | Match | Overall | Est. Profit |
|---|---|---|---|---|---|
 | Spider-Man: Into the Spider-Verse | 2018 | Shared genres: 8 | 95.7 | $98,145,763 |
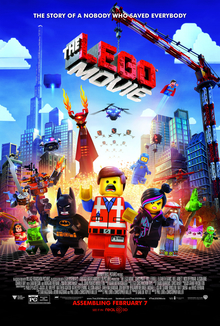 | The Lego Movie | 2014 | Shared genres: 8 | 95.0 | $154,543,340 |
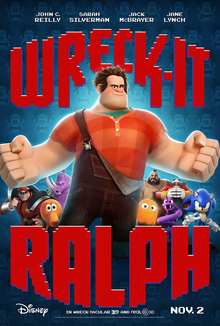 | Wreck-It Ralph | 2012 | Shared genres: 8 | 94.7 | $-16,922,147 |
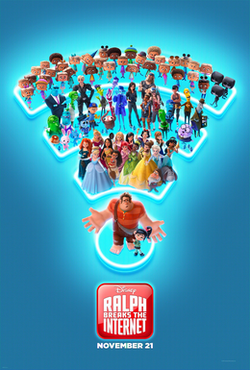 | Ralph Breaks the Internet | 2018 | Shared genres: 8 | 92.1 | $-24,744,565 |
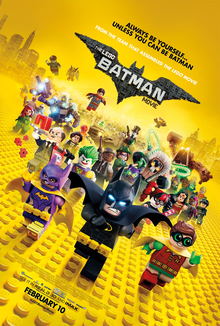 | The Lego Batman Movie | 2017 | Shared genres: 8 | 91.1 | $-84,350,700 |