Synopsis
The Rugrats get tangled in an exotic adventure, where they're helped by the Thornberrys, a family that travels the world making nature documentaries.
Scores
Overall Score
63.1
Popularity Percentile (Year)
57.3%
Box Office Percentile (Year)
82.1%
Review Aggregate
43.2
Critic Consensus
Critic reception is mixed, with 39% of 80 logged reviews marked Fresh. Across reviews, critics repeatedly emphasize family-friendly, thin plot, lighthearted. Common reservations focus on thin plot, even when reviewers praise standout elements.
family-friendlythin plotlightheartedvisually strikingfunnycoming of agecharacter-drivengritty
Cast
| Cast | Year | Reported Salary | Inflation Adjusted | Notes |
|---|---|---|---|---|
| E. G. Daily | 2003 | $1,406,000 | $2,397,000 | (est) |
| Nancy Cartwright | 2003 | $865,000 | $1,475,000 | (est) |
| Kath Soucie | 2003 | $652,000 | $1,111,000 | (est) |
| Dionne Quan | 2003 | $533,000 | $908,000 | (est) |
| Cheryl Chase | 2003 | $456,000 | $777,000 | (est) |
| Tim Curry | 2003 | $401,000 | $684,000 | (est) |
| Lacey Chabert | 2003 | $360,000 | $614,000 | (est) |
| Bruce Willis | 2003 | $328,000 | $559,000 | (est) |
Aggregated Reviews
Rotten Tomatoes critic score39.0
RT critic review count87
Rotten Tomatoes audience score39.0
RT audience rating count10,000
IMDb rating5.6
IMDb votes9,412
Box Office ?
| Category | Year | Reported | Inflation Adjusted |
|---|---|---|---|
| Domestic | 2003 | $39,402,572 | $67,177,102 |
| International | 2003 | $15,847,924 | $27,018,988 |
| Worldwide | 2003 | $55,250,496 | $94,196,090 |
Earnings / Profitability
| Category | Year | Reported | Inflation Adjusted |
|---|---|---|---|
| Revenues | |||
| Theatrical Net Revenue | 2003 | $26,040,456 | $44,396,146 |
| Digital Rentals ? | 2003 | $92,000 | $156,850 |
| Digital Purchases ? | 2003 | N/A | N/A |
| Physical Rentals ? | 2003 | $18,239,000 | $31,095,512 |
| Physical Purchases ? | 2003 | $33,275,000 | $56,730,258 |
| TV & Streaming Revenue | 2003 | $9,850,643 | $16,794,276 |
| Total Revenues | 2003 | $87,497,099 | $149,173,043 |
| Expenses | |||
| Budget ? | 2003 | $25,000,000 | $42,622,283 |
| Print & Advertising (P&A) ? source | 2003 | $15,000,000 | $25,573,370 |
| Participations | 2003 | $7,000,000 | $11,934,239 |
| Residuals ? | 2003 | $4,280,000 | $7,296,935 |
| Interest & Overhead | 2003 | $4,250,000 | $7,245,788 |
| Total Expenses | 2003 | $55,530,000 | $94,672,614 |
| Movie Net Profit or Loss | 2003 | $31,967,099 | $54,500,428 |
Similar Movies
| Poster | Movie | Year | Match | Overall | Est. Profit |
|---|---|---|---|---|---|
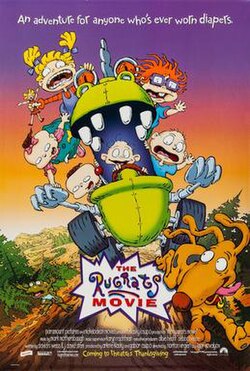 | The Rugrats Movie | 1998 | Shared franchise (1) | 74.5 | $76,902,846 |
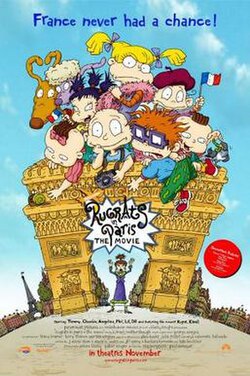 | Rugrats in Paris | 2000 | Shared franchise (1) | 75.6 | $56,318,167 |
 | Alvin and the Chipmunks | 2007 | Shared genres: 8 | 83.3 | $92,591,269 |
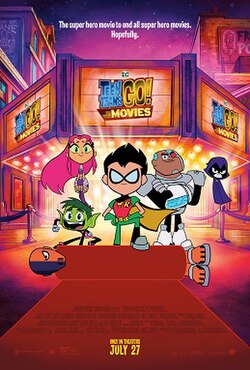 | Teen Titans GO! To the Movies | 2018 | Shared genres: 8 | 80.5 | $20,239,775 |
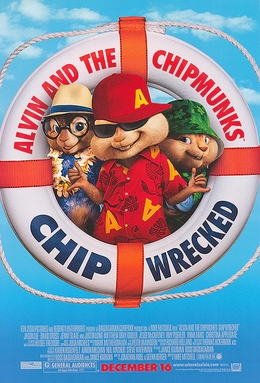 | Alvin and the Chipmunks: Chipwrecked | 2011 | Shared genres: 8 | 73.9 | $58,378,256 |