Synopsis
On a quest to save the video game 'Sugar Rush' and to find a replacement, Ralph and his best friend Vanellope travel to the World Wide Web through a Wi-Fi router they find at the arcade.
Scores
Overall Score
92.1
Popularity Percentile (Year)
94.8%
Box Office Percentile (Year)
98.3%
Review Aggregate
75.1
Critic Consensus
Critic reception is largely positive, with 88% of 274 logged reviews marked Fresh. Across reviews, critics repeatedly emphasize family-friendly, funny, lighthearted. Most critics frame the film as an effective delivery of its core style and intent.
family-friendlyfunnylightheartedemotionalvisually strikingsatiricaldarkcoming of agescarymacabre
Cast
| Cast | Year | Reported Salary | Inflation Adjusted | Notes |
|---|---|---|---|---|
| John C. Reilly | 2018 | $13,920,000 | $17,390,000 | (est) |
| Sarah Silverman | 2018 | $8,569,000 | $10,705,000 | (est) |
| Gal Gadot | 2018 | $6,451,000 | $8,060,000 | (est) |
| Jane Lynch | 2018 | $5,275,000 | $6,590,000 | (est) |
| Jack McBrayer | 2018 | $4,512,000 | $5,637,000 | (est) |
| Alan Tudyk | 2018 | $3,971,000 | $4,961,000 | (est) |
| Alfred Molina | 2018 | $3,565,000 | $4,454,000 | (est) |
| Ed O'Neill | 2018 | $3,247,000 | $4,056,000 | (est) |
| Taraji P. Henson | 2018 | $2,990,000 | $3,735,000 | (est) |
Aggregated Reviews
Rotten Tomatoes critic score88.0
RT critic review count274
Rotten Tomatoes audience score64.0
RT audience rating count5,000
IMDb rating7.0
IMDb votes198,870
Box Office ?
| Category | Year | Reported | Inflation Adjusted |
|---|---|---|---|
| Domestic | 2018 | $201,091,711 | $251,224,491 |
| International | 2018 | $328,232,251 | $410,061,558 |
| Worldwide | 2018 | $529,323,962 | $661,286,049 |
Earnings / Profitability
| Category | Year | Reported | Inflation Adjusted |
|---|---|---|---|
| Revenues | |||
| Theatrical Net Revenue | 2018 | $231,838,756 | $289,636,869 |
| Digital Rentals ? | 2018 | $4,469,000 | $5,583,135 |
| Digital Purchases ? | 2018 | $5,389,000 | $6,732,494 |
| Physical Rentals ? | 2018 | $2,753,000 | $3,439,331 |
| Physical Purchases ? | 2018 | $7,810,000 | $9,757,057 |
| TV & Streaming Revenue | 2018 | $56,305,679 | $70,342,858 |
| Total Revenues | 2018 | $308,565,435 | $385,491,744 |
| Expenses | |||
| Budget ? | 2018 | $175,000,000 | $218,628,037 |
| Print & Advertising (P&A) ? | 2018 | $127,372,000 (est) | $159,126,230 (est) |
| Participations | 2018 | $6,171,000 | $7,709,449 |
| Residuals ? | 2018 | $3,767,000 | $4,706,125 |
| Interest & Overhead | 2018 | $21,000,000 | $26,235,364 |
| Total Expenses | 2018 | $333,310,000 | $416,405,205 |
| Movie Net Profit or Loss | 2018 | $-24,744,565 | $-30,913,461 |
Similar Movies
| Poster | Movie | Year | Match | Overall | Est. Profit |
|---|---|---|---|---|---|
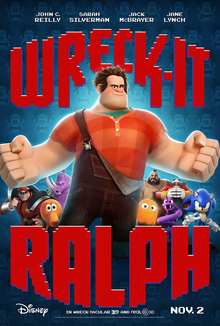 | Wreck-It Ralph | 2012 | Shared franchise (1) | 94.7 | $-16,922,147 |
 | Spider-Man: Into the Spider-Verse | 2018 | Shared genres: 8 | 95.7 | $98,145,763 |
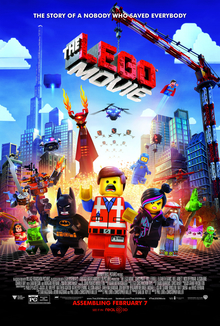 | The Lego Movie | 2014 | Shared genres: 8 | 95.0 | $154,543,340 |
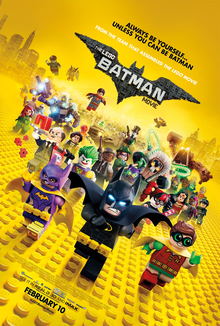 | The Lego Batman Movie | 2017 | Shared genres: 8 | 91.1 | $-84,350,700 |
 | Cloudy with a Chance of Meatballs | 2009 | Shared genres: 8 | 91.1 | $15,196,155 |