Synopsis
The adventures of an orphaned boy named Pete and his best friend Elliott, who happens to be a dragon.
Scores
Overall Score
84.5
Popularity Percentile (Year)
82.1%
Box Office Percentile (Year)
91.8%
Review Aggregate
77.2
Critic Consensus
Critic reception is largely positive, with 88% of 244 logged reviews marked Fresh. Across reviews, critics repeatedly emphasize family-friendly, lighthearted, emotional. Most critics frame the film as an effective delivery of its core style and intent.
family-friendlylightheartedemotionalvisually strikingcharacter-drivenstylizedrealisticscaryupliftingdark
Cast
| Cast | Year | Reported Salary | Inflation Adjusted | Notes |
|---|---|---|---|---|
| Bryce Dallas Howard | 2016 | $5,086,000 | $6,648,000 | (est) |
| Oakes Fegley | 2016 | $3,131,000 | $4,092,000 | (est) |
| Wes Bentley | 2016 | $2,357,000 | $3,081,000 | (est) |
| Karl Urban | 2016 | $1,927,000 | $2,519,000 | (est) |
| Oona Laurence | 2016 | $1,648,000 | $2,155,000 | (est) |
| Robert Redford | 2016 | $1,451,000 | $1,897,000 | (est) |
Aggregated Reviews
Rotten Tomatoes critic score88.0
RT critic review count244
Rotten Tomatoes audience score72.0
RT audience rating count25,000
IMDb rating6.7
IMDb votes63,478
Box Office ?
| Category | Year | Reported | Inflation Adjusted |
|---|---|---|---|
| Domestic | 2016 | $76,233,151 | $99,643,081 |
| International | 2016 | $67,462,187 | $88,178,700 |
| Worldwide | 2016 | $143,695,338 | $187,821,781 |
Earnings / Profitability
| Category | Year | Reported | Inflation Adjusted |
|---|---|---|---|
| Revenues | |||
| Theatrical Net Revenue | 2016 | $65,101,450 | $85,093,021 |
| Digital Rentals ? | 2016 | $4,470,000 | $5,842,662 |
| Digital Purchases ? | 2016 | $4,557,000 | $5,956,379 |
| Physical Rentals ? | 2016 | $3,924,000 | $5,128,995 |
| Physical Purchases ? | 2016 | $11,075,000 | $14,475,948 |
| TV & Streaming Revenue | 2016 | $19,058,288 | $24,910,770 |
| Total Revenues | 2016 | $108,185,738 | $141,407,775 |
| Expenses | |||
| Budget ? | 2016 | $65,000,000 | $84,960,417 |
| Print & Advertising (P&A) ? | 2016 | $77,573,000 (est) | $101,394,375 (est) |
| Participations | 2016 | $2,164,000 | $2,828,528 |
| Residuals ? | 2016 | $2,296,000 | $3,001,063 |
| Interest & Overhead | 2016 | $9,750,000 | $12,744,062 |
| Total Expenses | 2016 | $156,783,000 | $204,928,446 |
| Movie Net Profit or Loss | 2016 | $-48,597,262 | $-63,520,671 |
Similar Movies
| Poster | Movie | Year | Match | Overall | Est. Profit |
|---|---|---|---|---|---|
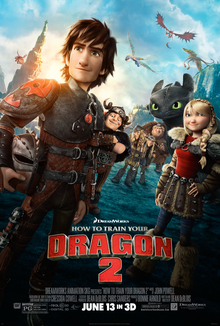 | How to Train Your Dragon 2 | 2014 | Shared genres: 11 | 95.1 | $48,707,119 |
 | The Jungle Book | 2016 | Shared franchise (1) | 95.5 | $136,030,745 |
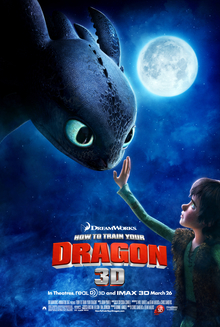 | How to Train Your Dragon | 2010 | Shared genres: 10 | 97.3 | $3,305,371 |
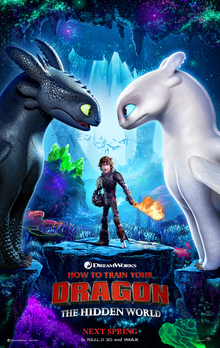 | How to Train Your Dragon: The Hidden World | 2019 | Shared genres: 10 | 93.8 | $37,361,614 |
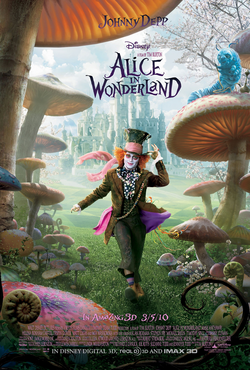 | Alice in Wonderland | 2010 | Shared franchise (1) | 90.0 | $170,274,844 |