Total Domestic
$2.79B
| Poster | Movie | Release Date | Worldwide | Estimated Profit | Overall Score |
|---|---|---|---|---|---|
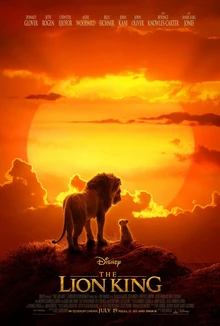 | The Lion King | Jul 19, 2019 | $1.66B | $343.04M | 92.4 |
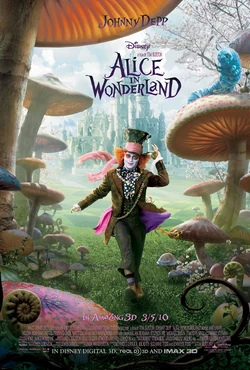 | Alice in Wonderland | Mar 5, 2010 | $1.03B | $170.27M | 90.0 |
 | Aladdin | May 24, 2019 | $1.05B | $151.39M | 93.2 |
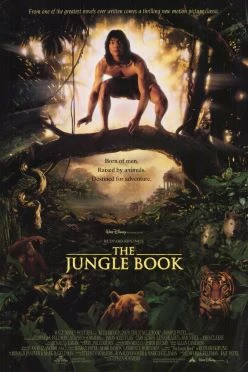
 | The Jungle Book | Apr 15, 2016 | $966.55M | $136.03M | 95.5 |
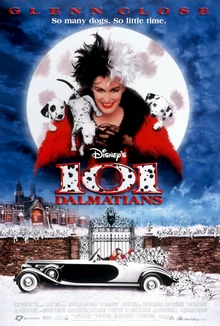 | 101 Dalmatians | Nov 27, 1996 | $136.19M | $75.36M | 85.7 |
 | The Jungle Book | Dec 25, 1994 | $43.23M | $57.53M | 72.4 |
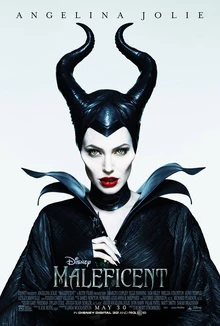 | Maleficent | May 30, 2014 | $758.41M | $56.85M | 90.8 |
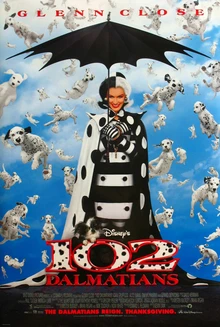 | 102 Dalmatians | Nov 22, 2000 | $183.61M | $13.12M | 78.9 |
 | Oz the Great and Powerful | Mar 8, 2013 | $493.31M | -$31.56M | 88.8 |
 | Cruella | May 28, 2021 | $233.5M | -$40.28M | 93.6 |
 | Pete's Dragon | Aug 12, 2016 | $143.7M | -$48.6M | 84.5 |
 | Dumbo | Mar 29, 2019 | $353.28M | -$69.59M | 83.4 |
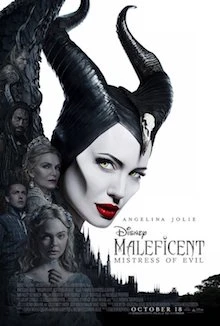 | Maleficent: Mistress of Evil | Oct 18, 2019 | $491.73M | -$73.58M | 89.3 |
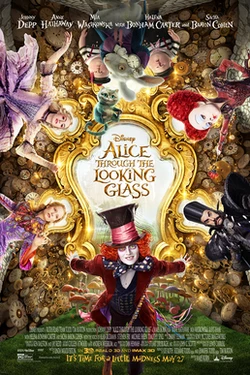 | Alice Through the Looking Glass | May 27, 2016 | $299.46M | -$174.77M | 82.4 |
 | Beauty and the Beast | Feb 12, 2016 | $160.22K | -$415.23M | 62.2 |