Synopsis
Teenage elf brothers Ian and Barley embark on a magical quest to spend one more day with their late father. Like any good adventure, their journey is filled with cryptic maps, impossible obstacles and unimaginable discoveries.
Scores
Overall Score
93.6
Popularity Percentile (Year)
94.4%
Box Office Percentile (Year)
96.4%
Review Aggregate
87.0
Critic Consensus
Critic reception is largely positive, with 88% of 346 logged reviews marked Fresh. Across reviews, critics repeatedly emphasize emotional, family-friendly, funny. Most critics frame the film as an effective delivery of its core style and intent.
emotionalfamily-friendlyfunnylightheartedvisually strikingcoming of agecharacter-drivensuspensefulstylizeddark
Cast
| Cast | Year | Reported Salary | Inflation Adjusted | Notes |
|---|---|---|---|---|
| Tom Holland | 2020 | $28,479,000 | $34,520,000 | (est) |
| Chris Pratt | 2020 | $17,531,000 | $21,250,000 | (est) |
| Julia Louis-Dreyfus | 2020 | $13,199,000 | $15,999,000 | (est) |
| Octavia Spencer | 2020 | $10,791,000 | $13,081,000 | (est) |
Aggregated Reviews
Rotten Tomatoes critic score88.0
RT critic review count346
Rotten Tomatoes audience score95.0
RT audience rating count5,000
IMDb rating7.4
IMDb votes181,629
Box Office ?
| Category | Year | Reported | Inflation Adjusted |
|---|---|---|---|
| Domestic | 2020 | $61,555,145 | $74,613,018 |
| International | 2020 | $80,333,131 | $97,374,433 |
| Worldwide | 2020 | $141,888,276 | $171,987,450 |
Earnings / Profitability
| Category | Year | Reported | Inflation Adjusted |
|---|---|---|---|
| Revenues | |||
| Theatrical Net Revenue | 2020 | $62,910,825 | $76,256,282 |
| Digital Rentals ? | 2020 | $18,258,000 | $22,131,123 |
| Digital Purchases ? | 2020 | $16,899,000 | $20,483,834 |
| Physical Rentals ? | 2020 | $4,255,000 | $5,157,626 |
| Physical Purchases ? | 2020 | $12,827,000 | $15,548,029 |
| TV & Streaming Revenue | 2020 | $15,388,786 | $18,653,254 |
| Total Revenues | 2020 | $130,538,611 | $158,230,148 |
| Expenses | |||
| Budget ? | 2020 | $200,000,000 | $242,426,584 |
| Print & Advertising (P&A) ? | 2020 | $35,083,000 (est) | $42,525,259 (est) |
| Participations | 2020 | $2,611,000 | $3,164,879 |
| Residuals ? | 2020 | $3,113,000 | $3,773,370 |
| Interest & Overhead | 2020 | $24,000,000 | $29,091,190 |
| Total Expenses | 2020 | $264,807,000 | $320,981,282 |
| Movie Net Profit or Loss | 2020 | $-134,268,389 | $-162,751,134 |
Similar Movies
| Poster | Movie | Year | Match | Overall | Est. Profit |
|---|---|---|---|---|---|
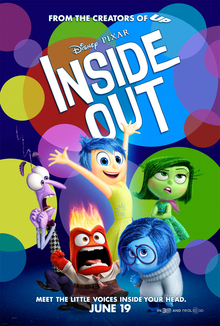 | Inside Out | 2015 | Shared genres: 7 | 97.4 | $115,137,542 |
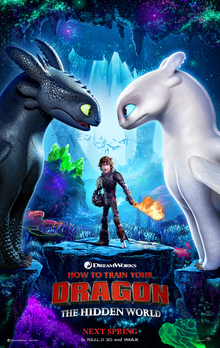 | How to Train Your Dragon: The Hidden World | 2019 | Shared genres: 7 | 93.8 | $37,361,614 |
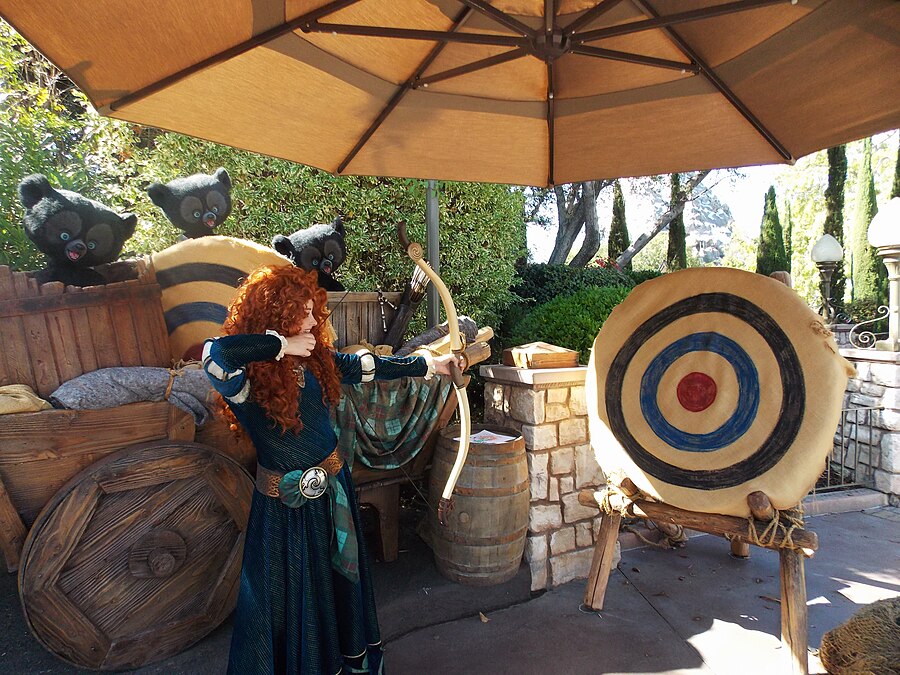 | Brave | 2012 | Shared genres: 7 | 93.2 | $-7,895,099 |
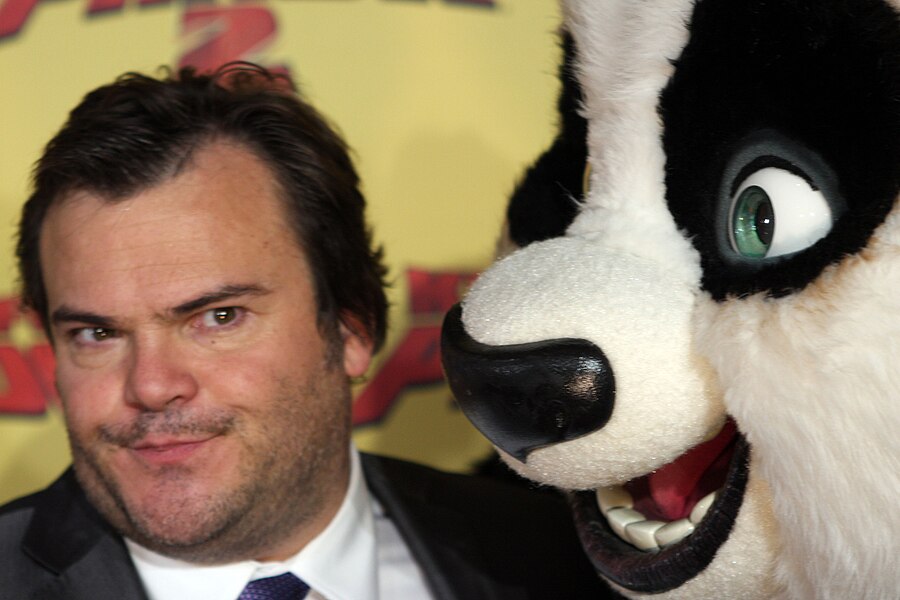 | Kung Fu Panda 2 | 2011 | Shared genres: 7 | 93.0 | $34,809,556 |
 | Raya and the Last Dragon | 2021 | Shared genres: 7 | 91.5 | $-121,180,686 |