Synopsis
The Muppets set sail in search of treasure, with Jim Hawkins and Long John Silver.
Scores
Overall Score
76.6
Popularity Percentile (Year)
72.6%
Box Office Percentile (Year)
84.0%
Review Aggregate
72.6
Critic Consensus
Critic reception is mixed, with 71% of 14 logged reviews marked Fresh. Across reviews, critics repeatedly emphasize funny, family-friendly, romantic. Common reservations focus on execution consistency, even when reviewers praise standout elements.
funnyfamily-friendlyromanticaction-packedcharacter-drivenemotional
Cast
| Cast | Year | Reported Salary | Inflation Adjusted | Notes |
|---|---|---|---|---|
| Tim Curry | 1996 | $394,000 | $788,000 | (est) |
| Dave Goelz | 1996 | $242,000 | $485,000 | (est) |
| Steve Whitmire | 1996 | $183,000 | $365,000 | (est) |
| Jerry Nelson | 1996 | $149,000 | $298,000 | (est) |
| Kevin Clash | 1996 | $128,000 | $255,000 | (est) |
| Frank Oz | 1996 | $112,000 | $225,000 | (est) |
Aggregated Reviews
Rotten Tomatoes critic score71.0
RT critic review count28
Rotten Tomatoes audience score77.0
RT audience rating count50,000
IMDb rating6.9
IMDb votes28,298
Box Office ?
| Category | Year | Reported | Inflation Adjusted |
|---|---|---|---|
| Domestic | 1996 | $34,327,391 | $68,632,903 |
| International | 1996 | N/A | N/A |
| Worldwide | 1996 | $34,327,766 | $68,633,653 |
Earnings / Profitability
| Category | Year | Reported | Inflation Adjusted |
|---|---|---|---|
| Revenues | |||
| Theatrical Net Revenue | 1996 | $17,163,696 | $34,316,452 |
| Digital Rentals ? | 1996 | N/A | N/A |
| Digital Purchases ? | 1996 | N/A | N/A |
| Physical Rentals ? | 1996 | $33,183,000 | $66,344,851 |
| Physical Purchases ? | 1996 | $39,313,000 | $78,600,944 |
| TV & Streaming Revenue | 1996 | $8,581,848 | $17,158,226 |
| Total Revenues | 1996 | $98,241,543 | $196,420,472 |
| Expenses | |||
| Budget ? | 1996 | $25,703,000 (est) | $51,389,618 (est) |
| Print & Advertising (P&A) ? | 1996 | $12,526,000 (est) | $25,044,017 (est) |
| Participations | 1996 | $7,859,000 | $15,712,991 |
| Residuals ? | 1996 | $5,768,000 | $11,532,324 |
| Interest & Overhead | 1996 | $4,369,510 | $8,736,235 |
| Total Expenses | 1996 | $56,225,510 | $112,415,185 |
| Movie Net Profit or Loss | 1996 | $42,016,033 | $84,005,288 |
Similar Movies
| Poster | Movie | Year | Match | Overall | Est. Profit |
|---|---|---|---|---|---|
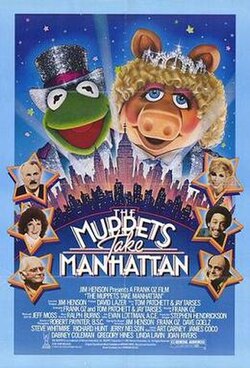 | The Muppets Take Manhattan | 1984 | Shared franchise (1) | 75.0 | $20,556,027 |
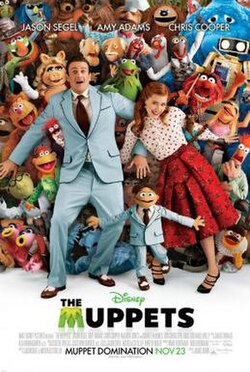 | The Muppets | 2011 | Shared franchise (1) | 86.6 | $17,357,628 |
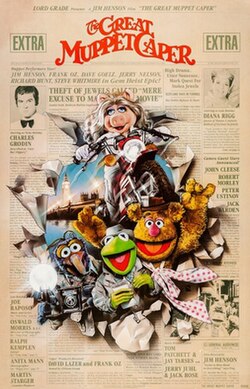 | The Great Muppet Caper | 1981 | Shared franchise (1) | 72.1 | $9,832,688 |
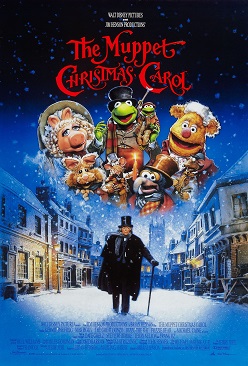 | The Muppet Christmas Carol | 1992 | Shared franchise (1) | 83.7 | $59,659,501 |
 | Muppets from Space | 1999 | Shared franchise (1) | 67.3 | $12,815,219 |