Synopsis
An orphan becomes the disciple of a powerful sorcerer and is drawn into a larger conflict among the world's magical elite.
Scores
Overall Score
49.4
Popularity Percentile (Year)
24.7%
Box Office Percentile (Year)
85.6%
Review Aggregate
41.7
Critic Consensus
Critic reception is largely negative, with 0% of 1 logged reviews marked Fresh. Across reviews, critics repeatedly emphasize action-packed, stylized, lighthearted. Many reviews cite execution consistency as the main reasons it falls short.
action-packedstylizedlightheartedcharacter-drivenemotionalvisually striking
Cast
| Cast | Year | Reported Salary | Inflation Adjusted | Notes |
|---|---|---|---|---|
| Fan Bingbing | 2016 | $615,000 | $804,000 | (est) |
| Kris Wu | 2016 | $378,000 | $495,000 | (est) |
| Cheney Chen | 2016 | $285,000 | $372,000 | (est) |
| Lin Yun | 2016 | $233,000 | $304,000 | (est) |
| William Chan | 2016 | $199,000 | $260,000 | (est) |
| Amber Kuo | 2016 | $175,000 | $229,000 | (est) |
| Yang Mi | 2016 | $157,000 | $206,000 | (est) |
| Aarif Rahman | 2016 | $143,000 | $187,000 | (est) |
| Yan Yikuan | 2016 | $132,000 | $173,000 | (est) |
| Roy Wang | 2016 | $123,000 | $160,000 | (est) |
| Wang Duo | 2016 | $115,000 | $150,000 | (est) |
Aggregated Reviews
Rotten Tomatoes critic scoreN/A
RT critic review count1
Rotten Tomatoes audience score35.0
RT audience rating count100
IMDb rating5.1
IMDb votes1,424
Box Office ?
| Category | Year | Reported | Inflation Adjusted |
|---|---|---|---|
| Domestic | 2016 | $350,456 | $458,075 |
| International | 2016 | $57,739,038 | $75,469,734 |
| Worldwide | 2016 | $58,089,494 | $75,927,809 |
Earnings / Profitability
| Category | Year | Reported | Inflation Adjusted |
|---|---|---|---|
| Revenues | |||
| Theatrical Net Revenue | 2016 | $23,270,843 | $30,416,931 |
| Digital Rentals ? | 2016 | $1,943,000 | $2,539,663 |
| Digital Purchases ? | 2016 | $1,980,000 | $2,588,025 |
| Physical Rentals ? | 2016 | $1,705,000 | $2,228,577 |
| Physical Purchases ? | 2016 | $4,812,000 | $6,289,685 |
| TV & Streaming Revenue | 2016 | $157,705 | $206,134 |
| Total Revenues | 2016 | $33,868,548 | $44,269,015 |
| Expenses | |||
| Budget ? | 2016 | $21,831,000 (est) | $28,534,936 (est) |
| Print & Advertising (P&A) ? | 2016 | $6,760,000 (est) | $8,835,883 (est) |
| Participations | 2016 | $677,000 | $884,895 |
| Residuals ? | 2016 | $603,000 | $788,171 |
| Interest & Overhead | 2016 | $4,366,200 | $5,706,987 |
| Total Expenses | 2016 | $34,237,200 | $44,750,874 |
| Movie Net Profit or Loss | 2016 | $-368,652 | $-481,858 |
Similar Movies
| Poster | Movie | Year | Match | Overall | Est. Profit |
|---|---|---|---|---|---|
 | Spider-Man: Into the Spider-Verse | 2018 | Shared genres: 6 | 95.7 | $98,145,763 |
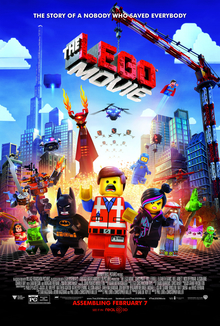 | The Lego Movie | 2014 | Shared genres: 6 | 95.0 | $154,543,340 |
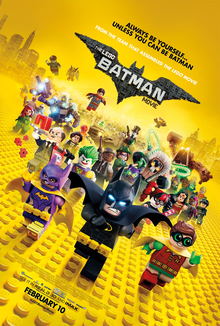 | The Lego Batman Movie | 2017 | Shared genres: 6 | 91.1 | $-84,350,700 |
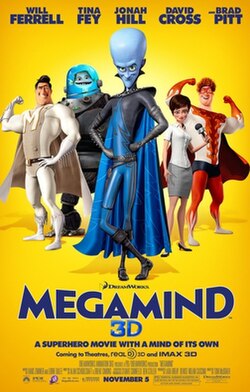 | Megamind | 2010 | Shared genres: 6 | 90.3 | $-80,051,670 |
 | Rise of the Guardians | 2012 | Shared genres: 6 | 90.1 | $-100,877,867 |