Synopsis
Archaeologist Indiana Jones races against time to retrieve a legendary artifact that can change the course of history.
Scores
Overall Score
91.9
Popularity Percentile (Year)
95.9%
Box Office Percentile (Year)
96.3%
Review Aggregate
75.1
Critic Consensus
No professional critic quote data was available to synthesize a consensus summary.
No tags
Cast
| Cast | Year | Reported Salary | Inflation Adjusted | Notes |
|---|---|---|---|---|
| Harrison Ford | 2023 | $25,000,000 source | $25,738,430 | reported |
| Phoebe Waller-Bridge | 2023 | $23,442,000 | $24,135,000 | (est) |
| Antonio Banderas | 2023 | $17,650,000 | $18,171,000 | (est) |
| John Rhys-Davies | 2023 | $14,431,000 | $14,857,000 | (est) |
| Toby Jones | 2023 | $12,344,000 | $12,708,000 | (est) |
| Boyd Holbrook | 2023 | $10,865,000 | $11,186,000 | (est) |
| Ethann Isidore | 2023 | $9,753,000 | $10,041,000 | (est) |
| Mads Mikkelsen | 2023 | $8,883,000 | $9,145,000 | (est) |
Aggregated Reviews
Rotten Tomatoes critic score71.0
RT critic review count438
Rotten Tomatoes audience score87.0
RT audience rating count10,000
IMDb rating6.5
IMDb votes224,538
Box Office ?
| Category | Year | Reported | Inflation Adjusted |
|---|---|---|---|
| Domestic | 2023 | $174,480,460 | $179,634,122 |
| International | 2023 | $209,482,590 | $215,670,117 |
| Worldwide | 2023 | $383,963,070 | $395,304,260 |
Earnings / Profitability
| Category | Year | Reported | Inflation Adjusted |
|---|---|---|---|
| Revenues | |||
| Theatrical Net Revenue | 2023 | $171,033,266 | $176,085,108 |
| Digital Rentals ? | 2023 | $6,061,000 | $6,240,025 |
| Digital Purchases ? | 2023 | $9,319,000 | $9,594,257 |
| Physical Rentals ? | 2023 | $1,335,000 | $1,374,432 |
| Physical Purchases ? | 2023 | $3,993,000 | $4,110,942 |
| TV & Streaming Revenue | 2023 | $48,854,529 | $50,297,554 |
| Total Revenues | 2023 | $240,595,795 | $247,702,318 |
| Expenses | |||
| Budget ? | 2023 | $387,000,000 | $398,430,892 |
| Print & Advertising (P&A) ? | 2023 | $101,066,000 (est) | $104,051,206 (est) |
| Participations | 2023 | $4,812,000 | $4,954,133 |
| Residuals ? | 2023 | $3,155,000 | $3,248,190 |
| Interest & Overhead | 2023 | $46,440,000 | $47,811,707 |
| Total Expenses | 2023 | $542,473,000 | $558,496,128 |
| Movie Net Profit or Loss | 2023 | $-301,877,205 | $-310,793,809 |
Similar Movies
| Poster | Movie | Year | Match | Overall | Est. Profit |
|---|---|---|---|---|---|
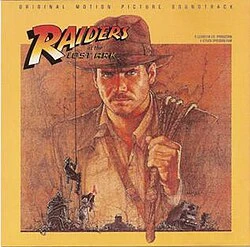 | Raiders of the Lost Ark | 1981 | Shared franchise (1) | 97.2 | $127,866,726 |
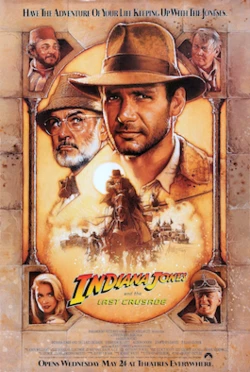 | Indiana Jones and the Last Crusade | 1989 | Shared franchise (1) | 97.0 | $128,031,038 |
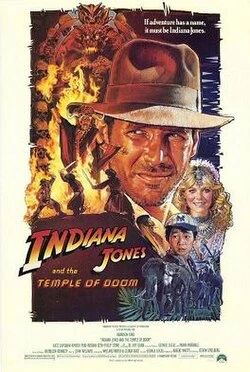 | Indiana Jones and the Temple of Doom | 1984 | Shared franchise (1) | 94.6 | $104,810,730 |
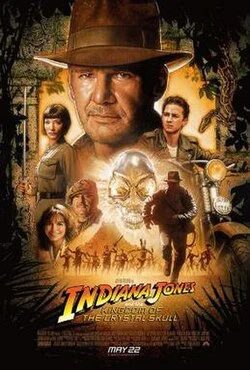 | Indiana Jones and the Kingdom of the Crystal Skull | 2008 | Shared franchise (1) | 92.1 | $96,021,912 |
 | Spider-Man: No Way Home | 2021 | Shared genres: 3 | 98.2 | $629,996,195 |