Synopsis
School's out. Summer vacation is on. However, Greg may not have the best summer vacation ever. What could go wrong?
Scores
Overall Score
70.9
Popularity Percentile (Year)
63.3%
Box Office Percentile (Year)
87.2%
Review Aggregate
59.4
Critic Consensus
Critic reception is largely positive, with 75% of 16 logged reviews marked Fresh. Across reviews, critics repeatedly emphasize family-friendly, funny, character-driven. Most critics frame the film as an effective delivery of its core style and intent.
family-friendlyfunnycharacter-drivenemotionalvisually strikingthought-provoking
Cast
| Cast | Year | Reported Salary | Inflation Adjusted | Notes |
|---|---|---|---|---|
| Brady Noon | 2012 | $1,582,000 | $2,161,000 | (est) |
| Ethan William Childress | 2012 | $974,000 | $1,330,000 | (est) |
| Chris Diamantopoulos | 2012 | $733,000 | $1,001,000 | (est) |
| Erica Cerra | 2012 | $599,000 | $819,000 | (est) |
| Hunter Dillon | 2012 | $513,000 | $700,000 | (est) |
Aggregated Reviews
Rotten Tomatoes critic score75.0
RT critic review count16
Rotten Tomatoes audience score39.0
RT audience rating count250
IMDb rating6.3
IMDb votes32,663
Box Office ?
| Category | Year | Reported | Inflation Adjusted |
|---|---|---|---|
| Domestic | 2012 | $49,008,664 | $66,960,006 |
| International | 2012 | $28,221,032 | $38,558,090 |
| Worldwide | 2012 | $77,229,696 | $105,518,096 |
Earnings / Profitability
| Category | Year | Reported | Inflation Adjusted |
|---|---|---|---|
| Revenues | |||
| Theatrical Net Revenue | 2012 | $35,792,745 | $48,903,239 |
| Digital Rentals ? | 2012 | $4,194,000 | $5,730,217 |
| Digital Purchases ? | 2012 | $1,885,000 | $2,575,455 |
| Physical Rentals ? | 2012 | $6,647,000 | $9,081,724 |
| Physical Purchases ? | 2012 | $16,422,000 | $22,437,200 |
| TV & Streaming Revenue | 2012 | $12,252,166 | $16,740,002 |
| Total Revenues | 2012 | $77,192,911 | $105,467,837 |
| Expenses | |||
| Budget ? | 2012 | $22,000,000 | $30,058,361 |
| Print & Advertising (P&A) ? | 2012 | $26,367,000 (est) | $36,024,946 (est) |
| Participations | 2012 | $3,088,000 | $4,219,101 |
| Residuals ? | 2012 | $2,515,000 | $3,436,217 |
| Interest & Overhead | 2012 | $4,400,000 | $6,011,672 |
| Total Expenses | 2012 | $58,370,000 | $79,750,298 |
| Movie Net Profit or Loss | 2012 | $18,822,911 | $25,717,539 |
Similar Movies
| Poster | Movie | Year | Match | Overall | Est. Profit |
|---|---|---|---|---|---|
 | Diary of a Wimpy Kid | 2010 | Shared franchise (1) | 76.5 | $48,993,883 |
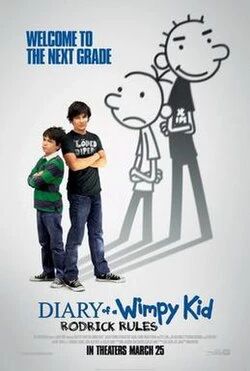 | Diary of a Wimpy Kid: Rodrick Rules | 2011 | Shared franchise (1) | 72.7 | $21,127,286 |
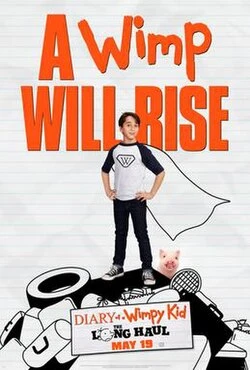 | Diary of a Wimpy Kid: The Long Haul | 2017 | Shared franchise (1) | 64.3 | $-6,509,445 |
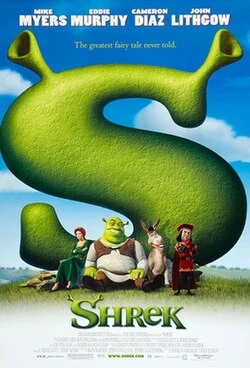 | Shrek | 2001 | Shared genres: 5 | 95.9 | $196,186,888 |
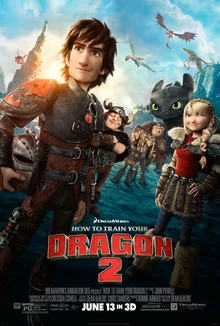 | How to Train Your Dragon 2 | 2014 | Shared genres: 5 | 95.1 | $48,707,125 |