Synopsis
When a new criminal comes to town, the Anti-Villain League decides to hire Gru in order to fight him off. While Gru initially refuses, he eventually agrees after his aide goes back to his evil ways.
Scores
Overall Score
94.3
Popularity Percentile (Year)
97.4%
Box Office Percentile (Year)
99.6%
Review Aggregate
78.0
Critic Consensus
Critic reception is mixed, with 75% of 183 logged reviews marked Fresh. Across reviews, critics repeatedly emphasize funny, family-friendly, thin plot. Common reservations focus on thin plot, even when reviewers praise standout elements.
funnyfamily-friendlythin plotlightheartedromanticvisually strikingsurrealstylizedtragicdark
Cast
| Cast | Year | Reported Salary | Inflation Adjusted | Notes |
|---|---|---|---|---|
| Steve Carell | 2013 | $5,488,000 | $7,389,000 | (est) |
| Kristen Wiig | 2013 | $3,378,000 | $4,548,000 | (est) |
| Benjamin Bratt | 2013 | $2,544,000 | $3,425,000 | (est) |
| Miranda Cosgrove | 2013 | $2,080,000 | $2,800,000 | (est) |
| Russell Brand | 2013 | $1,779,000 | $2,395,000 | (est) |
| Steve Coogan | 2013 | $1,566,000 | $2,108,000 | (est) |
| Ken Jeong | 2013 | $1,406,000 | $1,892,000 | (est) |
Aggregated Reviews
Rotten Tomatoes critic score75.0
RT critic review count184
Rotten Tomatoes audience score85.0
RT audience rating count250,000
IMDb rating7.3
IMDb votes449,291
Box Office ?
| Category | Year | Reported | Inflation Adjusted |
|---|---|---|---|
| Domestic | 2013 | $368,065,380 | $495,545,505 |
| International | 2013 | $602,700,600 | $811,447,068 |
| Worldwide | 2013 | $970,766,000 | $1,306,992,600 |
Earnings / Profitability
| Category | Year | Reported | Inflation Adjusted |
|---|---|---|---|
| Revenues | |||
| Theatrical Net Revenue | 2013 | $425,112,930 | $572,351,580 |
| Digital Rentals ? | 2013 | $5,621,000 | $7,567,844 |
| Digital Purchases ? | 2013 | $3,361,000 | $4,525,089 |
| Physical Rentals ? | 2013 | $7,266,000 | $9,782,593 |
| Physical Purchases ? | 2013 | $18,826,000 | $25,346,420 |
| TV & Streaming Revenue | 2013 | $128,822,883 | $173,440,927 |
| Total Revenues | 2013 | $589,009,813 | $793,014,451 |
| Expenses | |||
| Budget ? | 2013 | $76,000,000 | $102,322,741 |
| Print & Advertising (P&A) ? | 2013 | $95,000,000 (est) | $127,903,426 (est) |
| Participations | 2013 | $88,351,000 | $118,951,532 |
| Residuals ? | 2013 | $8,424,000 | $11,341,668 |
| Interest & Overhead | 2013 | $11,400,000 | $15,348,411 |
| Total Expenses | 2013 | $279,175,000 | $375,867,778 |
| Movie Net Profit or Loss | 2013 | $309,834,813 | $417,146,674 |
Similar Movies
| Poster | Movie | Year | Match | Overall | Est. Profit |
|---|---|---|---|---|---|
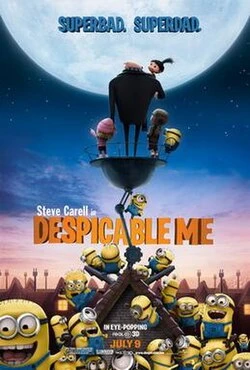 | Despicable Me | 2010 | Shared franchise (1) | 94.7 | $148,300,052 |
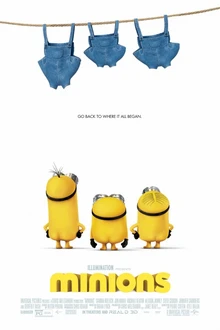 | Minions | 2015 | Shared franchise (1) | 89.4 | $-54,242,048 |
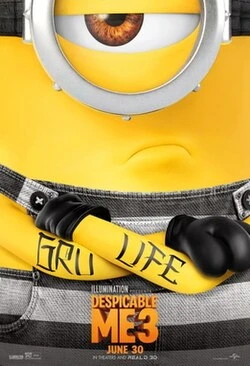 | Despicable Me 3 | 2017 | Shared franchise (1) | 87.7 | $261,095,994 |
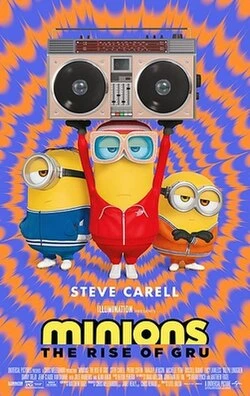 | Minions: The Rise of Gru | 2022 | Shared franchise (1) | 89.4 | $53,785,966 |
 | Penguins of Madagascar | 2014 | Shared genres: 9 | 87.5 | $-38,999,938 |