Synopsis
The inspiring true love story of Robin and Diana Cavendish, an adventurous couple who refuse to give up in the face of a devastating disease.
Scores
Overall Score
69.1
Popularity Percentile (Year)
71.6%
Box Office Percentile (Year)
65.1%
Review Aggregate
70.3
Critic Consensus
Critic reception is mixed, with 67% of 166 logged reviews marked Fresh. Across reviews, critics repeatedly emphasize historical, emotional, character-driven. Common reservations focus on thin plot, even when reviewers praise standout elements.
historicalemotionalcharacter-drivenromanticthin plotupliftingfamily-friendlylightheartedvisually strikinggritty
Cast
| Cast | Year | Reported Salary | Inflation Adjusted | Notes |
|---|---|---|---|---|
| Andrew Garfield | 2017 | $978,000 | $1,252,000 | (est) |
| Claire Foy | 2017 | $602,000 | $771,000 | (est) |
| Tom Hollander | 2017 | $453,000 | $580,000 | (est) |
| Hugh Bonneville | 2017 | $371,000 | $474,000 | (est) |
| Dean-Charles Chapman | 2017 | $317,000 | $406,000 | (est) |
| Ed Speleers | 2017 | $279,000 | $357,000 | (est) |
Aggregated Reviews
Rotten Tomatoes critic score67.0
RT critic review count166
Rotten Tomatoes audience score73.0
RT audience rating count2,500
IMDb rating7.2
IMDb votes26,105
Box Office ?
| Category | Year | Reported | Inflation Adjusted |
|---|---|---|---|
| Domestic | 2017 | $490,131 | $627,312 |
| International | 2017 | $4,640,656 | $5,939,509 |
| Worldwide | 2017 | $5,130,787 | $6,566,821 |
Earnings / Profitability
| Category | Year | Reported | Inflation Adjusted |
|---|---|---|---|
| Revenues | |||
| Theatrical Net Revenue | 2017 | $2,101,328 | $2,689,460 |
| Digital Rentals ? | 2017 | $2,452,000 | $3,138,280 |
| Digital Purchases ? | 2017 | $2,736,000 | $3,501,767 |
| Physical Rentals ? | 2017 | $1,829,000 | $2,340,911 |
| Physical Purchases ? | 2017 | $5,253,000 | $6,723,240 |
| TV & Streaming Revenue | 2017 | $205,855 | $263,471 |
| Total Revenues | 2017 | $14,577,183 | $18,657,128 |
| Expenses | |||
| Budget ? | 2017 | $15,000,000 | $19,198,286 |
| Print & Advertising (P&A) ? | 2017 | $3,025,000 (est) | $3,871,654 (est) |
| Participations | 2017 | $292,000 | $373,727 |
| Residuals ? | 2017 | $682,000 | $872,882 |
| Interest & Overhead | 2017 | $3,000,000 | $3,839,657 |
| Total Expenses | 2017 | $21,999,000 | $28,156,206 |
| Movie Net Profit or Loss | 2017 | $-7,421,817 | $-9,499,078 |
Similar Movies
| Poster | Movie | Year | Match | Overall | Est. Profit |
|---|---|---|---|---|---|
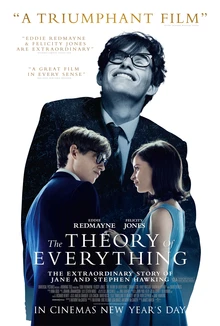 | The Theory of Everything | 2014 | Shared genres: 6 | 91.8 | $42,996,412 |
 | The Sessions | 2012 | Shared genres: 6 | 74.0 | $25,823,688 |
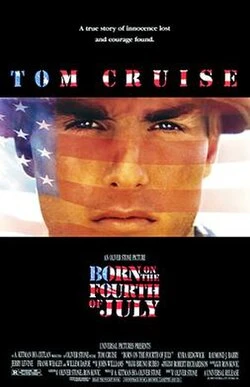 | Born on the Fourth of July | 1989 | Shared genres: 5 | 88.1 | $74,920,323 |
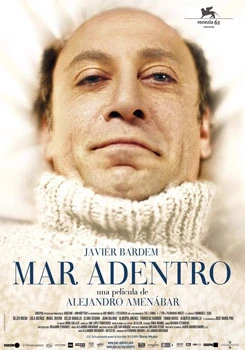 | The Sea Inside | 2004 | Shared genres: 5 | 81.2 | $31,615,642 |
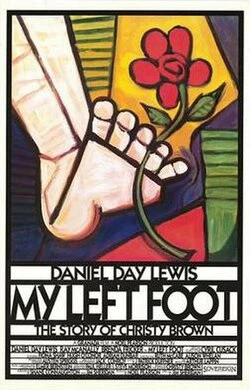 | My Left Foot | 1989 | Shared genres: 5 | 79.1 | $48,650,109 |