Synopsis
Ethan Wate longs to escape his small southern town. He meets a mysterious new girl, Lena Duchannes. Together, they uncover dark secrets about their respective families, their history, and their town.
Scores
Overall Score
76.8
Popularity Percentile (Year)
81.7%
Box Office Percentile (Year)
84.2%
Review Aggregate
53.0
Critic Consensus
No professional critic quote data was available to synthesize a consensus summary.
No tags
Cast
| Cast | Year | Reported Salary | Inflation Adjusted | Notes |
|---|---|---|---|---|
| Alden Ehrenreich | 2013 | $4,333,000 | $5,833,000 | (est) |
| Alice Englert | 2013 | $2,667,000 | $3,591,000 | (est) |
| Jeremy Irons | 2013 | $2,008,000 | $2,704,000 | (est) |
| Viola Davis | 2013 | $1,642,000 | $2,210,000 | (est) |
| Emmy Rossum | 2013 | $1,404,000 | $1,891,000 | (est) |
| Thomas Mann | 2013 | $1,236,000 | $1,664,000 | (est) |
| Emma Thompson | 2013 | $1,110,000 | $1,494,000 | (est) |
Aggregated Reviews
Rotten Tomatoes critic score47.0
RT critic review count180
Rotten Tomatoes audience score54.0
RT audience rating count25,000
IMDb rating6.1
IMDb votes92,567
Box Office ?
| Category | Year | Reported | Inflation Adjusted |
|---|---|---|---|
| Domestic | 2013 | $19,452,138 | $26,189,424 |
| International | 2013 | $40,600,000 | $54,661,888 |
| Worldwide | 2013 | $60,052,138 | $80,851,312 |
Earnings / Profitability
| Category | Year | Reported | Inflation Adjusted |
|---|---|---|---|
| Revenues | |||
| Theatrical Net Revenue | 2013 | $25,966,069 | $34,959,467 |
| Digital Rentals ? | 2013 | $4,257,000 | $5,731,420 |
| Digital Purchases ? | 2013 | $2,545,000 | $3,426,466 |
| Physical Rentals ? | 2013 | $5,503,000 | $7,408,975 |
| Physical Purchases ? | 2013 | $14,258,000 | $19,196,286 |
| TV & Streaming Revenue | 2013 | $4,668,513 | $6,285,462 |
| Total Revenues | 2013 | $57,197,582 | $77,008,075 |
| Expenses | |||
| Budget ? | 2013 | $60,000,000 | $80,781,116 |
| Print & Advertising (P&A) ? | 2013 | $37,345,000 (est) | $50,279,513 (est) |
| Participations | 2013 | $1,144,000 | $1,540,227 |
| Residuals ? | 2013 | $1,918,000 | $2,582,303 |
| Interest & Overhead | 2013 | $9,000,000 | $12,117,167 |
| Total Expenses | 2013 | $109,407,000 | $147,300,326 |
| Movie Net Profit or Loss | 2013 | $-52,209,418 | $-70,292,251 |
Similar Movies
| Poster | Movie | Year | Match | Overall | Est. Profit |
|---|---|---|---|---|---|
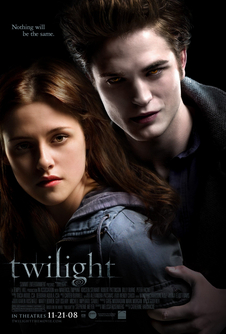 | Twilight | 2008 | Shared genres: 8 | 90.2 | $157,209,631 |
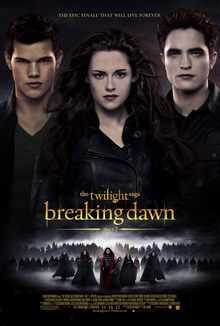 | The Twilight Saga: Breaking Dawn - Part 2 | 2012 | Shared genres: 8 | 89.5 | $201,719,128 |
 | The Twilight Saga: Eclipse | 2010 | Shared genres: 8 | 88.1 | $233,606,827 |
 | The Twilight Saga: New Moon | 2009 | Shared genres: 8 | 86.4 | $281,760,620 |
 | The Twilight Saga: Breaking Dawn - Part 1 | 2011 | Shared genres: 8 | 85.9 | $178,278,453 |