Synopsis
As their surrounding community has taken a turn for the worse, the crew at Calvin's Barbershop come together to bring some much needed change to their neighborhood.
Scores
Overall Score
75.9
Popularity Percentile (Year)
69.5%
Box Office Percentile (Year)
85.1%
Review Aggregate
74.2
Critic Consensus
Critic reception is largely positive, with 91% of 92 logged reviews marked Fresh. Across reviews, critics repeatedly emphasize funny, political, lighthearted. Most critics frame the film as an effective delivery of its core style and intent.
funnypoliticallightheartedemotionalgrittyfamily-friendlyrealisticstylizedromanticuplifting
Cast
| Cast | Year | Reported Salary | Inflation Adjusted | Notes |
|---|---|---|---|---|
| Ice Cube | 2016 | $923,000 | $1,207,000 | (est) |
| Cedric the Entertainer | 2016 | $568,000 | $743,000 | (est) |
| Regina Hall | 2016 | $428,000 | $559,000 | (est) |
| Anthony Anderson | 2016 | $350,000 | $457,000 | (est) |
| Eve | 2016 | $299,000 | $391,000 | (est) |
| J.B. Smoove | 2016 | $263,000 | $344,000 | (est) |
| Lamorne Morris | 2016 | $236,000 | $309,000 | (est) |
| Sean Patrick Thomas | 2016 | $215,000 | $281,000 | (est) |
| Tyga | 2016 | $198,000 | $259,000 | (est) |
| Deon Cole | 2016 | $184,000 | $241,000 | (est) |
| Common | 2016 | $172,000 | $225,000 | (est) |
| Nicki Minaj | 2016 | $162,000 | $212,000 | (est) |
Aggregated Reviews
Rotten Tomatoes critic score91.0
RT critic review count92
Rotten Tomatoes audience score66.0
RT audience rating count10,000
IMDb rating5.9
IMDb votes16,820
Box Office ?
| Category | Year | Reported | Inflation Adjusted |
|---|---|---|---|
| Domestic | 2016 | $54,030,052 | $70,621,777 |
| International | 2016 | $1,600,000 | $2,091,333 |
| Worldwide | 2016 | $55,630,052 | $72,713,110 |
Earnings / Profitability
| Category | Year | Reported | Inflation Adjusted |
|---|---|---|---|
| Revenues | |||
| Theatrical Net Revenue | 2016 | $27,655,026 | $36,147,422 |
| Digital Rentals ? | 2016 | $4,086,000 | $5,340,742 |
| Digital Purchases ? | 2016 | $4,165,000 | $5,444,002 |
| Physical Rentals ? | 2016 | $3,587,000 | $4,688,508 |
| Physical Purchases ? | 2016 | $10,122,000 | $13,230,297 |
| TV & Streaming Revenue | 2016 | $13,507,513 | $17,655,444 |
| Total Revenues | 2016 | $63,122,539 | $82,506,414 |
| Expenses | |||
| Budget ? | 2016 | $20,000,000 | $26,141,665 |
| Print & Advertising (P&A) ? | 2016 | $25,000,000 (est) | $32,677,082 (est) |
| Participations | 2016 | $2,525,000 | $3,300,385 |
| Residuals ? | 2016 | $1,910,000 | $2,496,529 |
| Interest & Overhead | 2016 | $4,000,000 | $5,228,333 |
| Total Expenses | 2016 | $53,435,000 | $69,843,994 |
| Movie Net Profit or Loss | 2016 | $9,687,539 | $12,662,420 |
Similar Movies
| Poster | Movie | Year | Match | Overall | Est. Profit |
|---|---|---|---|---|---|
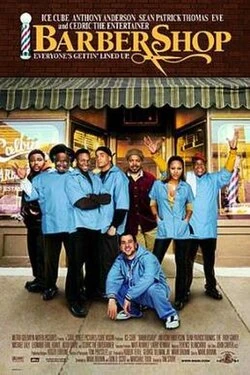 | Barbershop | 2002 | Shared franchise (1) | 77.2 | $75,458,306 |
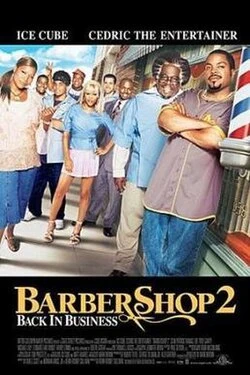 | Barbershop 2: Back in Business | 2004 | Shared franchise (1) | 73.9 | $33,044,525 |
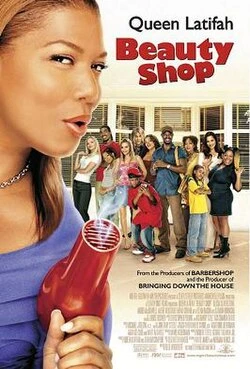 | Beauty Shop | 2005 | Shared franchise (1) | 67.5 | $29,570,155 |
 | Up | 2009 | Shared genres: 2 | 97.7 | $103,203,496 |
 | Inside Out | 2015 | Shared genres: 2 | 97.4 | $115,137,525 |