
Indican Pictures
Dynamic entity page generated from imported ScreenProfits movie metadata.
Distributor
Studio
Movies219
Years2000-2025
Avg Score28.1
Worldwide Gross$12,183,142
Associated Movies
| Poster | Movie | Year | Overall | Popularity % | Box Office % | Worldwide | Profit/Loss (Est.) | Profit (Inflation Adj) |
|---|---|---|---|---|---|---|---|---|

|
2015 | 37.6 | 51.6% | 6.2% | $5K | -$3M | -$5M | |

|
2024 | 37.3 | 22.6% | 30.8% | $207K | -$341K | -$350K | |
|
2011 | 37.2 | 44.1% | 8.5% | $15K | -$342K | -$490K | |

|
2009 | 37.0 | 13.1% | 43.5% | $781K | -$21K | -$31K | |
|
2014 | 36.9 | 29.0% | 19.3% | $21K | -$2M | -$3M | |

|
2024 | 36.3 | 17.1% | 38.7% | $443K | $71K | $73K | |

|
2013 | 36.2 | 50.8% | 15.9% | $13K | -$6M | -$8M | |

|
2001 | 35.4 | 23.2% | 26.4% | $412K | -$320K | -$581K | |

|
2017 | 35.4 | 36.7% | 17.9% | $20K | -$954K | -$1M | |

|
2017 | 35.2 | 37.4% | 20.4% | $24K | -$3M | -$4M | |

|
The Bra
COVID-era
|
2020 | 35.1 | 29.7% | 24.9% | $47K | -$331K | -$412K |

|
2025 | 34.9 | 18.2% | 39.3% | $624K | -$991K | -$991K | |

|
2004 | 34.7 | 21.0% | 35.1% | $217K | -$262K | -$446K | |

|
2006 | 34.4 | 31.9% | 45.8% | $666K | -$338K | -$539K | |

|
2017 | 33.5 | 31.6% | 18.9% | $21K | -$337K | -$443K | |
|
2019 | 33.4 | 44.6% | 3.2% | $5K | -$22M | -$28M | |

|
2010 | 33.2 | 37.1% | 16.2% | $20K | -$318K | -$469K | |

|
2016 | 33.1 | 13.7% | 45.2% | $511K | -$316K | -$424K | |

|
2017 | 32.4 | 29.2% | 6.3% | $6K | -$351K | -$461K | |
|
2010 | 32.3 | 30.7% | 27.9% | $71K | -$3M | -$4M | |
|
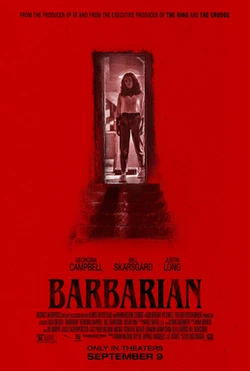
2019 | 32.0 | 33.3% | 8.4% | $11K | -$5M | -$6M | |

|
2010 | 31.9 | 36.3% | 11.0% | $11K | -$346K | -$510K | |

|
2017 | 31.2 | 11.7% | 33.7% | $110K | -$11M | -$14M | |

|
2019 | 30.8 | 12.2% | 25.4% | $88K | -$275K | -$346K | |

|
2006 | 30.2 | 17.1% | 43.1% | $463K | -$2M | -$3M | |

|
2019 | 29.5 | 29.8% | 9.1% | $11K | -$44M | -$54M | |

|
2024 | 29.2 | 26.2% | 15.1% | $36K | -$326K | -$335K | |

|
2010 | 29.2 | 3.0% | 33.4% | $140K | -$256K | -$377K | |

|
Strike
COVID-era
|
2020 | 29.1 | 20.2% | 18.1% | $25K | -$55K | -$68K |

|
In the Life of Music
COVID-era
|
2020 | 28.2 | 19.8% | 9.0% | $7K | -$348K | -$432K |

|
2010 | 27.3 | 8.3% | 30.4% | $99K | -$263K | -$389K | |

|
2024 | 26.9 | 24.3% | 5.1% | $12K | -$348K | -$357K | |

|
2017 | 26.9 | 16.5% | 19.4% | $22K | -$11M | -$14M | |

|
2023 | 26.8 | 27.8% | 5.4% | $8K | -$350K | -$370K | |

|
2025 | 26.7 | 32.9% | 3.0% | $10K | -$349K | -$349K | |

|
2005 | 26.5 | 3.8% | 30.6% | $102K | -$251K | -$413K | |

|
2019 | 26.4 | 13.8% | 18.6% | $39K | -$321K | -$404K | |

|
2002 | 26.3 | 3.2% | 28.1% | $164K | -$243K | -$435K | |

|
Harper
Recovery period
|
2021 | 26.1 | 10.7% | 16.1% | $20K | -$336K | -$399K |

|
2018 | 26.0 | 20.3% | 22.4% | $58K | -$303K | -$388K | |

|
2000 | 25.5 | 10.8% | 32.9% | $441K | -$412K | -$771K | |
|
2018 | 25.2 | 18.0% | 15.0% | $26K | -$333K | -$427K | |

|
2010 | 25.1 | 5.8% | 32.9% | $119K | -$259K | -$382K | |

|
2018 | 24.9 | 18.2% | 13.1% | $21K | -$337K | -$433K | |

|
2008 | 24.7 | 8.9% | 35.5% | $244K | -$248K | -$371K | |
| 2009 | 24.7 | 27.1% | 9.3% | $14K | -$249K | -$374K | ||

|
2005 | 24.5 | 0.6% | 41.3% | $403K | -$246K | -$406K | |

|
2009 | 24.5 | 6.0% | 27.1% | $103K | -$260K | -$391K | |

|
2015 | 24.5 | 24.8% | 1.1% | $1K | -$355K | -$483K | |

|
2006 | 24.1 | 4.9% | 31.0% | $105K | -$252K | -$403K |