
IFC Films
Dynamic entity page generated from imported ScreenProfits movie metadata.
Studio
Distributor
Production Company
Movies594
Years1997-2025
Avg Score48.7
Worldwide Gross$1,774,246,942
Associated Movies
| Poster | Movie | Year | Overall | Popularity % | Box Office % | Worldwide | Profit/Loss (Est.) | Profit (Inflation Adj) |
|---|---|---|---|---|---|---|---|---|

|
2008 | 44.8 | 44.3% | 40.1% | $408K | -$9M | -$13M | |

|
2024 | 44.7 | 60.5% | 17.7% | $45K | -$319K | -$327K | |

|
2014 | 44.4 | 60.6% | 18.9% | $20K | -$344K | -$468K | |

|
2012 | 44.4 | 53.6% | 33.8% | $118K | -$3M | -$4M | |

|
2003 | 44.4 | 42.1% | 39.2% | $453K | -$526K | -$920K | |

|
2010 | 44.3 | 47.2% | 35.5% | $168K | -$341K | -$503K | |

|
2016 | 44.3 | 55.0% | 30.2% | $82K | -$281K | -$377K | |

|
2011 | 44.1 | 25.6% | 66.5% | $9M | -$8M | -$10M | |

|
2005 | 44.0 | 30.8% | 44.1% | $640K | -$22K | -$37K | |

|
2013 | 43.9 | 35.7% | 48.0% | $440K | -$5M | -$6M | |

|
2014 | 43.9 | 33.8% | 52.0% | $866K | -$9M | -$12M | |
|
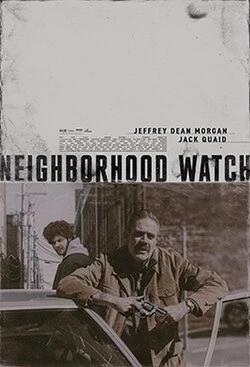
2025 | 43.9 | 57.8% | 12.7% | $36K | -$341K | -$341K | |

|
2025 | 43.7 | 43.7% | 35.6% | $450K | -$627K | -$627K | |

|
2018 | 43.7 | 75.3% | 1.3% | $3K | -$354K | -$106M | |

|
2011 | 43.6 | 52.1% | 34.3% | $230K | -$363K | -$519K | |

|
2025 | 43.5 | 43.5% | 35.4% | $425K | -$597K | -$597K | |

|
2019 | 43.5 | 59.9% | 14.1% | $23K | -$339K | -$427K | |

|
Demonic
Recovery period
|
2021 | 43.4 | 52.3% | 44.1% | $367K | -$2M | -$2M |

|
2023 | 43.4 | 36.2% | 29.9% | $187K | -$274K | -$290K | |

|
2018 | 43.3 | 34.1% | 33.6% | $154K | -$258K | -$330K | |

|
2012 | 43.3 | 50.4% | 44.8% | $413K | -$659K | -$924K | |

|
2011 | 43.3 | 29.5% | 36.6% | $280K | -$274K | -$392K | |

|
2007 | 43.3 | 50.0% | 27.3% | $98K | -$8M | -$12M | |

|
2006 | 43.2 | 44.1% | 31.9% | $121K | -$252K | -$402K | |

|
2002 | 43.1 | 53.3% | 13.4% | $31K | -$325K | -$581K | |

|
The Djinn
COVID-era
|
2021 | 43.0 | 49.0% | 45.6% | $404K | -$6M | -$7M |

|
2015 | 43.0 | 46.1% | 44.5% | $555K | -$886K | -$1M | |

|
2014 | 42.8 | 49.6% | 16.1% | $15K | -$329K | -$448K | |

|
2005 | 42.8 | 43.5% | 34.7% | $182K | -$227K | -$375K | |

|
2013 | 42.7 | 33.0% | 36.4% | $117K | -$267K | -$369K | |

|
The Feast
Recovery period
|
2021 | 42.7 | 43.3% | 30.9% | $81K | -$319K | -$379K |

|
2014 | 42.7 | 46.2% | 34.4% | $83K | -$4M | -$6M | |

|
2008 | 42.2 | 44.6% | 44.4% | $675K | -$968K | -$1M | |

|
Moffie
COVID-era
|
2021 | 42.2 | 45.1% | 17.7% | $29K | -$330K | -$392K |

|
2008 | 42.1 | 56.2% | 21.5% | $53K | -$331K | -$494K | |

|
2022 | 42.1 | 44.5% | 20.4% | $35K | -$326K | -$359K | |

|
2012 | 42.0 | 30.7% | 37.3% | $155K | -$269K | -$377K | |

|
2013 | 42.0 | 44.0% | 50.9% | $644K | -$9M | -$12M | |

|
2014 | 41.9 | 45.9% | 29.6% | $56K | -$305K | -$415K | |
|
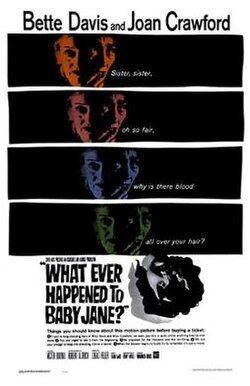
2017 | 41.8 | 25.0% | 41.8% | $323K | -$1M | -$1M | |

|
2003 | 41.8 | 41.1% | 27.4% | $148K | -$242K | -$423K | |

|
2009 | 41.8 | 27.3% | 54.3% | $2M | -$3M | -$4M | |

|
Embattled
COVID-era
|
2020 | 41.7 | 44.9% | 21.9% | $32K | -$321K | -$399K |
|
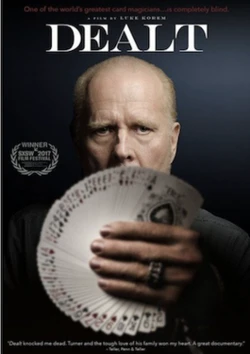
2017 | 41.7 | 36.0% | 23.3% | $30K | -$329K | -$432K | |

|
2020 | 41.5 | 53.1% | 18.5% | $25K | -$328K | -$408K | |

|
2010 | 41.5 | 26.1% | 34.2% | $152K | -$10M | -$14M | |
|
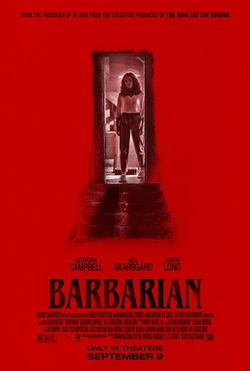
2022 | 41.5 | 50.2% | 12.1% | $14K | -$5M | -$5M | |

|
2025 | 41.4 | 40.2% | 40.9% | $708K | -$5M | -$5M | |

|
2015 | 41.4 | 38.2% | 32.4% | $123K | -$226K | -$307K | |

|
2024 | 41.3 | 42.2% | 31.9% | $226K | -$290K | -$298K |