
IFC Films
Dynamic entity page generated from imported ScreenProfits movie metadata.
Studio
Distributor
Production Company
Movies594
Years1997-2025
Avg Score48.7
Worldwide Gross$1,774,246,942
Associated Movies
| Poster | Movie | Year | Overall | Popularity % | Box Office % | Worldwide | Profit/Loss (Est.) | Profit (Inflation Adj) |
|---|---|---|---|---|---|---|---|---|
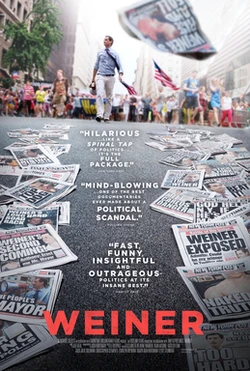
|
2016 | 64.1 | 61.7% | 54.6% | $2M | $825K | $1M | |
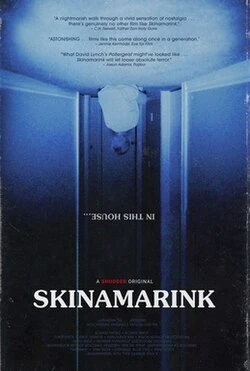
|
2023 | 63.9 | 72.4% | 57.0% | $2M | $2M | $2M | |
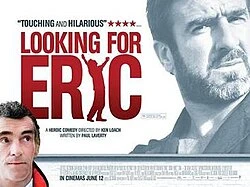
|
2010 | 63.7 | 54.9% | 66.6% | $12M | -$207K | -$306K | |
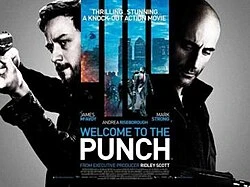
|
2013 | 63.6 | 69.2% | 65.7% | $4M | -$9M | -$12M | |

|
2012 | 63.6 | 75.1% | 50.1% | $933K | -$1M | -$2M | |
|
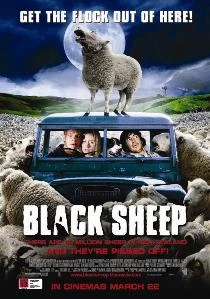
2007 | 63.5 | 66.2% | 61.4% | $5M | $609K | $946K | |

|
Made in Italy
COVID-era
|
2020 | 63.5 | 65.3% | 70.7% | $3M | -$2M | -$2M |

|
2010 | 63.5 | 72.1% | 47.2% | $809K | -$18M | -$26M | |

|
2018 | 63.4 | 61.8% | 66.6% | $4M | -$1M | -$2M | |

|
2024 | 63.3 | 61.5% | 69.8% | $6M | -$2M | -$2M | |

|
2015 | 63.3 | 68.6% | 60.5% | $4M | -$3M | -$5M | |

|
2019 | 63.3 | 58.4% | 66.7% | $4M | $36K | $45K | |
|
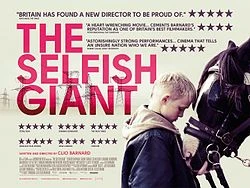
2013 | 63.2 | 59.0% | 55.6% | $1M | -$2M | -$2M | |

|
2013 | 63.1 | 66.9% | 55.1% | $1M | -$5M | -$6M | |

|
2011 | 63.0 | 63.1% | 49.1% | $1M | $401K | $578K | |
|
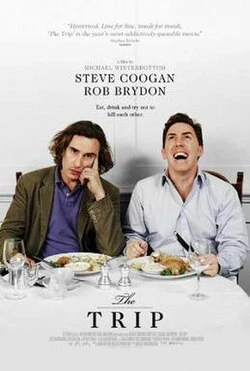
2011 | 62.9 | 59.3% | 59.0% | $4M | -$2M | -$3M | |

|
2018 | 62.6 | 70.7% | 60.2% | $2M | -$2M | -$2M | |
|
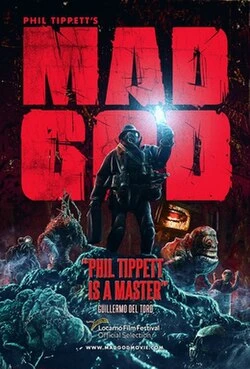
2022 | 62.6 | 71.0% | 43.3% | $325K | $33K | $40K | |
|
2006 | 62.6 | 67.0% | 68.1% | $11M | $2M | $3M | |
|
2015 | 62.5 | 69.2% | 53.6% | $1M | -$2M | -$3M | |
|
2022 | 62.5 | 68.9% | 48.2% | $508K | -$5M | -$5M | |

|
2009 | 62.4 | 52.0% | 65.3% | $10M | -$8M | -$12M | |

|
2016 | 62.4 | 65.8% | 53.4% | $2M | -$2M | -$3M | |
|
2018 | 62.4 | 80.0% | 34.9% | $168K | -$338K | -$434K | |
|
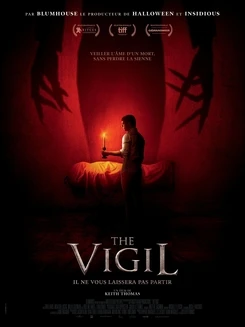
The Vigil
COVID-era
|
2021 | 62.3 | 61.1% | 59.3% | $1M | -$1M | -$1M |

|
2011 | 62.2 | 68.8% | 65.7% | $8M | -$7M | -$10M | |

|
2008 | 62.2 | 61.9% | 58.2% | $5M | -$4M | -$5M | |
|
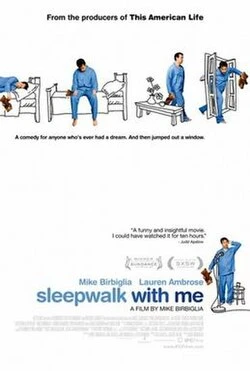
2012 | 62.1 | 59.4% | 58.5% | $2M | -$768K | -$1M | |

|
Undine
COVID-era
|
2021 | 62.1 | 60.1% | 57.2% | $1M | -$465K | -$553K |
|
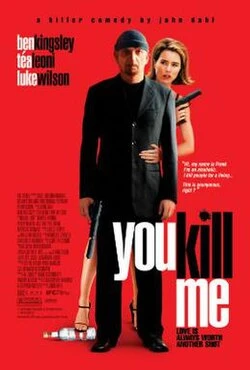
2007 | 62.1 | 61.0% | 59.9% | $4M | -$5M | -$7M | |

|
2018 | 62.0 | 68.7% | 42.4% | $324K | -$1M | -$2M | |

|
2012 | 61.9 | 67.9% | 51.5% | $1M | -$2M | -$2M | |

|
2011 | 61.9 | 60.7% | 62.2% | $5M | -$13M | -$18M | |
|
2007 | 61.8 | 64.2% | 72.1% | $15M | $6M | $9M | |

|
2019 | 61.7 | 61.3% | 70.8% | $6M | -$2M | -$2M | |
|
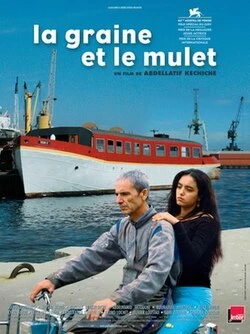
2008 | 61.7 | 45.8% | 70.7% | $15M | -$7M | -$9M | |
|
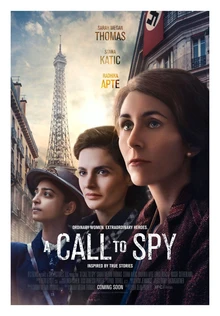
A Call to Spy
COVID-era
|
2020 | 61.3 | 61.2% | 55.8% | $786K | -$726K | -$903K |
|
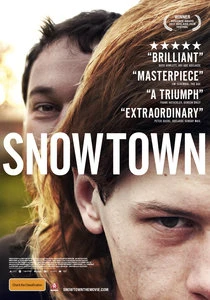
2012 | 61.2 | 61.9% | 53.2% | $1M | -$3M | -$4M | |
|
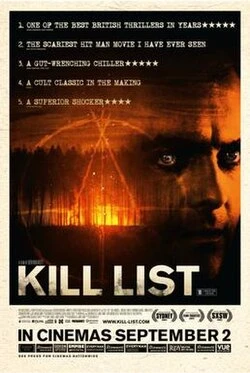
2012 | 61.1 | 70.4% | 45.3% | $450K | -$1M | -$1M | |
|
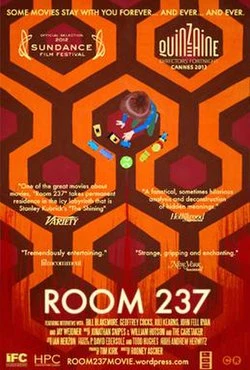
2013 | 60.9 | 67.0% | 46.5% | $367K | $161K | $222K | |
|
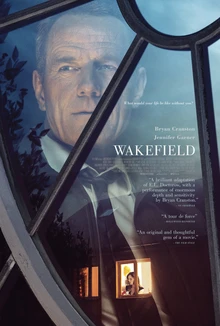
2017 | 60.8 | 68.8% | 48.9% | $798K | -$1M | -$2M | |
|
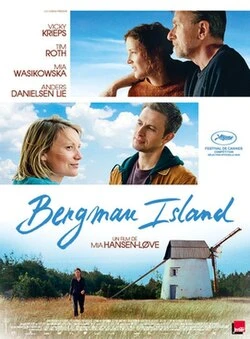
Bergman Island
Recovery period
|
2021 | 60.8 | 61.9% | 54.9% | $1M | -$936K | -$1M |
|
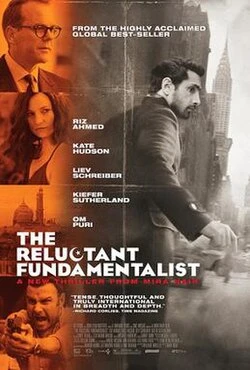
2013 | 60.8 | 60.4% | 61.3% | $2M | -$18M | -$24M | |

|
2024 | 60.7 | 59.4% | 45.2% | $768K | -$753K | -$773K | |

|
2009 | 60.7 | 49.4% | 57.6% | $4M | -$3M | -$4M | |

|
2012 | 60.5 | 53.0% | 55.8% | $2M | $235K | $329K | |
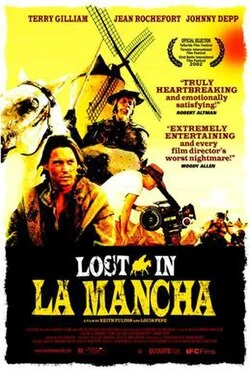
|
2003 | 60.4 | 59.1% | 49.3% | $1M | $133K | $234K | |
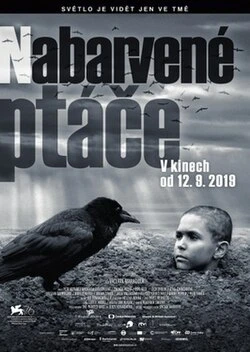
|
The Painted Bird
COVID-era
|
2020 | 60.1 | 58.8% | 53.1% | $660K | -$196M | -$238M |

|
2013 | 60.1 | 55.9% | 52.1% | $673K | -$1M | -$1M | |
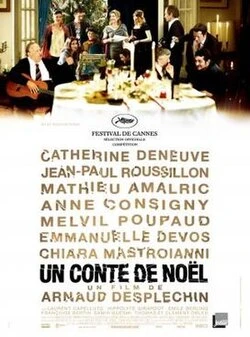
|
2008 | 60.0 | 50.7% | 63.5% | $7M | -$3M | -$4M |