
The Multiple Machine Is Running Again
The numbers are irresistible. Curry Barker’s Obsession — made for a shoestring $750,000 — has grossed roughly 200 times its budget. Combined with Kane Parsons’ Backrooms, the two May releases have pulled in $282 million worldwide and cracked the year’s domestic top 20, per The Ankler’s reporting. Cue the think pieces.
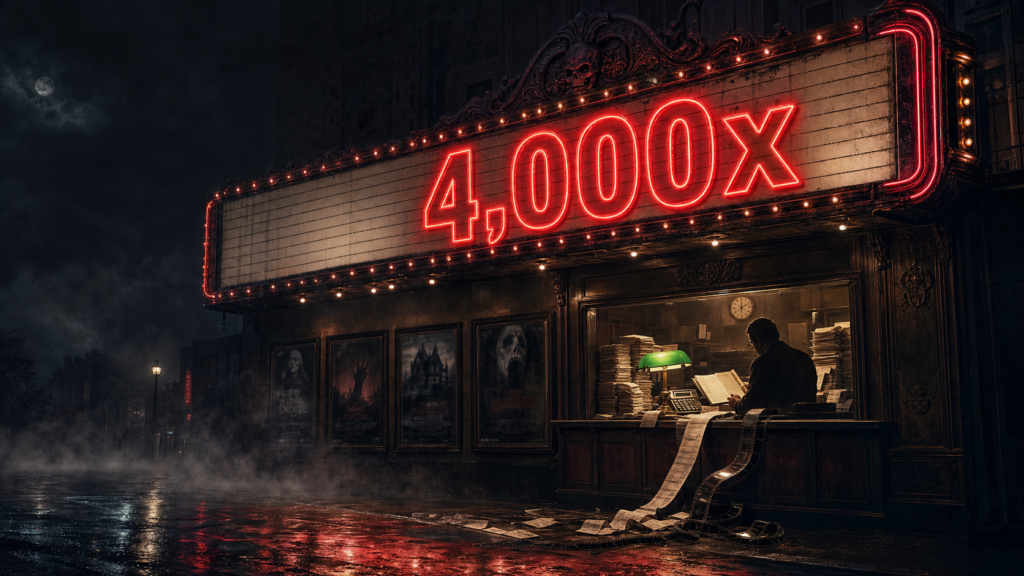
And the genre’s mythology practically writes itself: Halloween returned over $47 million on a $325,000 budget in 1978. The Blair Witch Project posted its legendary “4,000x” in 1999. Paranormal Activity hit an absurd “13,000x” in 2007 and launched the Blumhouse empire.
Those multiples are real in the narrowest arithmetic sense: worldwide gross divided by production budget. The problem is that neither number in that fraction represents money anyone actually kept.
What the Multiple Hides
A box office multiple ignores at least four layers of real-world economics:
1. Theaters keep roughly half. Exhibitors typically retain 40-55 percent of every domestic ticket sold, with the split negotiated week by week (Tools for Film). International splits are worse for the studio, and China returns only about 25 cents on the dollar. Before anything else happens, the gross is roughly cut in half.
2. Marketing often dwarfs a low budget. Prints and advertising (P&A) is a real cash cost that never appears in the multiple. On low-budget horror, marketing can run several times the production budget — one reason analysts note the standard break-even shorthand simply doesn’t work for micro-budget films (Reddit r/boxoffice). A national campaign can run $5-50 million regardless of what the film cost to shoot (AltStreet).
3. Distribution fees and the waterfall. Distributors recoup P&A off the top, then take fees of 20-40 percent depending on territory and window, before debt, gap financing, and equity get paid — with backend participants last in line (AltStreet).
4. The “budget” is only the negative cost. Residuals, interest, overhead, finishing costs and delivery all sit outside the reported production number.
Case Study: The Real Blair Witch Math
The Blair Witch Project is the genre’s favorite multiple — nearly $250 million worldwide on a reported $60,000 budget. But follow the actual cash:
- The filmmakers spent roughly $20,000-$25,000 to get through principal photography, with post-production pushing the true negative cost into the low hundreds of thousands (Wrapbook)
- Artisan paid $1.1 million to acquire it at Sundance, then spent another $320,000 finishing and enhancing it for theatrical release (Los Angeles Times, 1999)
- Artisan’s marketing outlay ran roughly $25 million across the theatrical run — putting its total investment near $30 million (Los Angeles Times)
So the “4,000x movie” was, for the company that actually distributed it, closer to a (still spectacular) 4x return on ~$30 million deployed — half of the $248 million gross came back as rentals against ~$30 million in costs. Phenomenal. But it’s a different universe from 4,000x.
The postscript is even more instructive: the filmmakers later sued Artisan, alleging the distributor claimed $75-80 million in unsubstantiated marketing expenses to shrink their backend (Variety, 2001). Which brings us to the uncomfortable answer to the obvious question.
So Is “Profit” the Better Metric? Yes — With One Big Asterisk
Profit is unquestionably the more honest measure: revenue actually received, minus all costs actually incurred, across all windows. It’s what investors get paid on. It’s what determines whether a studio greenlights the sequel.
The asterisk is that Hollywood has spent a century making reported profit nearly as slippery as the multiple. Under so-called Hollywood accounting, studios layer distribution fees, overhead charges, and interest onto a film’s ledger — often paid to their own subsidiaries — so that hits show paper losses (Wikipedia). Forrest Gump famously “lost” $62 million for net-profit-participation purposes (LA Business Journal). That’s why sophisticated talent negotiates for gross participation, not net.
The lesson for analysts: trust profit as a concept, but never trust a single reported profit number. Reconstruct it.
The ScreenProfits Toolkit: Metrics That Actually Work
Estimated net profit (the reconstructed kind). The gold standard: take ~50 percent of domestic gross and ~40 percent of international as rentals, subtract production budget, estimated P&A, and residuals, then add ancillary revenue (home entertainment, streaming and TV licensing). This is the methodology behind analyses showing a $200 million grosser can still lose money (ReelTally).
The 2-2.5x break-even rule — used correctly. Worldwide gross of roughly 2 to 2.5 times production budget remains a fair first-pass screen for conventionally budgeted studio films (ReelTally). But it breaks down at both extremes: micro-budget horror carries marketing that can be 5x+ the negative cost, while films with unusual P&A or territory mixes need bespoke math (AMW Glossary). Rule of thumb, not gospel.
Cash-on-cash return for actual investors. The Blumhouse standard. Jason Blum caps original budgets (historically $3-5 million, now $10-12 million as costs rise), pays talent union scale with profit-linked bonuses, and only greenlights films where a worst case means breaking roughly even (Fortune). The relevant question is never “what was the multiple?” — it’s “how much cash went in, and how much came back, and how fast?”
Opening-to-total multiplier (legs). A film that grosses 3-4x its opening weekend has genuine word of mouth; one that grosses 2x is front-loaded fan service. For horror — a genre notorious for 60 percent second-weekend drops — strong legs are the single clearest signal that a film broke out of the base.
Per-theater average. The best early read on demand intensity, especially in platform releases, and immune to budget-reporting games.
Full-cycle and franchise value. The multiple captures one window of one revenue stream. Paranormal Activity‘s real economic legacy wasn’t $193 million in tickets — it was a franchise approaching $1 billion worldwide on roughly $28 million in combined production spend (Medium), plus a repeatable studio model that has since grossed over $5.7 billion (Fortune). Similarly, the real value of a breakout is often the director pipeline: Barker already has a Texas Chainsaw Massacre reboot lined up, per The Ankler — that option value never shows up in the weekend chart.
What This Means for Obsession and Backrooms
None of this rains on the parade — it just replaces fantasy math with real math. Here’s what the actual cost stacks look like, using reported and estimated figures (both films’ grosses have kept climbing since the initial trade reports):
Obsession — estimated P&A: $10-20 million. The production budget was $750,000, but Focus Features and Blumhouse paid roughly $15 million just to acquire the film out of its TIFF premiere (Collider). On marketing, estimates diverge: industry budget tracker Saturation.io models P&A at approximately $20 million for a total investment near $35.75 million (Saturation.io), while Collider pegs the campaign at “likely less than $10 million” (Collider). The low-end case is supported by hard data: national TV ad spend was a modest $1.27 million (MediaPost), because Focus leaned on guerrilla tactics — cryptic billboards, a viral text-message line with 70,000+ participants, Letterboxd creator seeding and sold-out “One Wish Willow” merch (Forbes). Against a $404 million worldwide gross (Wikipedia), even the high-end ~$35 million all-in stack returns roughly $8.40 for every dollar invested (Saturation.io). So the honest multiple isn’t 500x — it’s about 8x. Still elite.
Backrooms — estimated P&A: $10-20 million. A24 and Chernin co-financed production for about $10 million (LA Times). Saturation.io estimates P&A at approximately $15 million for a ~$25 million total investment (Saturation.io); film financier Jeanette Milio puts the marketing figure closer to $20 million (LinkedIn). Deadline reports the spend ran higher than the $10 million NEON put behind Longlegs but was “still reasonable,” with A24 skipping traditional TV and outdoor in favor of a “for us, by us” campaign aimed at the fandom on YouTube, TikTok and Reddit (Deadline) — its national TV ad outlay before opening was just $583,000 (MediaPost). Against $330 million worldwide (Fortress of Solitude), a ~$25-30 million all-in stack returns roughly 5-6x on real money after theater splits.
That’s the paradox of micro-budget horror — the headline multiples are inflated as metrics, yet the underlying profitability is real precisely because even the hidden costs (acquisition fees, P&A, splits) can’t sink a denominator this small.
The multiple isn’t wrong about horror. It’s just the least precise way to be right.
The ScreenProfits bottom line: Multiples are for headlines. Break-even screens are for triage. Reconstructed net profit and cash-on-cash returns are for decisions. And if someone quotes you a “13,000x return,” ask them one question: whose money, and how much of it, actually came back?
Quick Reference: Reading a Horror Hit
| Metric | What it tells you | Blind spot |
|---|
| Metric | What it tells you | Blind spot |
|---|---|---|
| Box office multiple (gross ÷ budget) | Headline momentum, cultural heat | Ignores theater splits, P&A, fees — wildly inflated for micro-budgets |
| 2-2.5x break-even rule | First-pass profitability screen for studio-scale films | Breaks down for micro-budget horror and unusual P&A |
| Reconstructed net profit | Closest to economic truth | Requires estimates; studio-reported “net” is manipulable |
| Cash-on-cash return | What investors actually experience | Needs private data; varies by deal position in the waterfall |
| Opening-to-total multiplier | Word of mouth and staying power | Says nothing about costs |
| Per-theater average | Demand intensity, especially early | Small-sample noise in limited release |
| Franchise/library value | Long-term asset creation | Slow to materialize; speculative at release |
Sources
- Saturation.io — Obsession budget page / Backrooms budget page — estimated P&A and total investment models
- Deadline — Backrooms marketing strategy and spend context
- MediaPost — national TV ad spend for both films
- Forbes — Obsession guerrilla marketing campaign details
- Collider — Obsession marketing cost estimate and Focus acquisition price
- The Ankler — Obsession/Backrooms performance and horror multiples reporting (source article)
- Los Angeles Times (1999) — Artisan’s ~$30M total Blair Witch investment
- Variety (2001) — Haxan v. Artisan accounting dispute
- Wrapbook — Blair Witch true budget breakdown
- Tools for Film — exhibitor splits and distributor fee stack
- AltStreet — film revenue waterfall mechanics
- ReelTally — break-even math and territory splits
- AMW Glossary — limits of the 2-2.5x rule
- Fortune — Blumhouse budget caps and model economics
- Wikipedia — Hollywood accounting / LA Business Journal — net profit manipulation, Forrest Gump example