
Family
Dynamic genre archive. Imported movies in this genre will show automatically.
Movies992
Years1979-2026
Avg Score66.1
Worldwide Gross$120,000,263,924
Budget to WW Gross Multiple2.71x
Total Profit$-1,119,121,603
Total Profit (Inflation Adj)$-279,771,494
Top Movies in Family
This genre includes films released during the COVID-era disruption window of March 13, 2020 through June 30, 2021 and the recovery window of July 1, 2021 through December 31, 2021. Those titles are labeled in the table.
| Poster | Movie | Year | Overall | Popularity % | Box Office % | Worldwide | Profit/Loss (Est.) | Profit (Inflation Adj) |
|---|---|---|---|---|---|---|---|---|

|
2010 | 64.2 | 63.5% | 53.4% | $2M | -$9M | -$13M | |

|
2013 | 68.2 | 89.8% | 29.2% | $52K | -$10M | -$14M | |

|
2007 | 71.7 | 72.7% | 79.6% | $31M | -$9M | -$14M | |
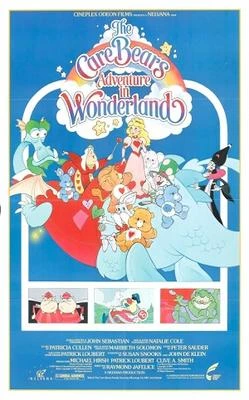
|
1987 | 25.6 | 7.4% | 33.1% | $3M | -$5M | -$14M | |

|
2018 | 64.5 | 68.3% | 71.4% | $8M | -$11M | -$14M | |

|
2016 | 49.9 | 35.6% | 57.3% | $3M | -$11M | -$14M | |

|
2014 | 47.5 | 31.2% | 69.4% | $7M | -$10M | -$14M | |

|
2007 | 60.7 | 61.7% | 59.4% | $3M | -$9M | -$14M | |

|
2001 | 59.7 | 45.9% | 77.4% | $44M | -$8M | -$14M | |

|
2004 | 48.7 | 31.6% | 63.6% | $6M | -$9M | -$14M | |

|
1999 | 34.7 | 15.3% | 52.0% | $2M | -$8M | -$15M | |

|
1991 | 49.7 | 49.6% | 53.6% | $9M | -$6M | -$15M | |

|
2011 | 26.3 | 17.7% | 21.3% | $53K | -$11M | -$15M | |

|
2002 | 70.2 | 71.6% | 71.0% | $19M | -$9M | -$15M | |

|
1998 | 77.1 | 83.7% | 83.1% | $55M | -$9M | -$15M | |

|
2017 | 75.2 | 77.2% | 67.5% | $7M | -$12M | -$15M | |

|
1995 | 39.8 | 30.4% | 44.1% | $6M | -$7M | -$15M | |

|
1998 | 64.8 | 59.0% | 74.8% | $27M | -$8M | -$15M | |

|
2016 | 57.5 | 55.7% | 44.9% | $496K | -$12M | -$15M | |
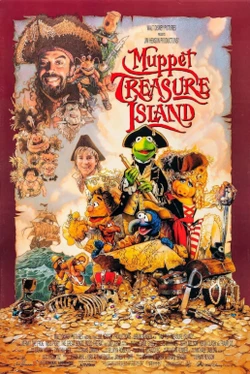
|
1996 | 76.6 | 72.6% | 84.0% | $34M | -$8M | -$15M | |
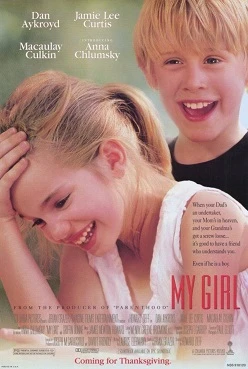
|
1994 | 75.8 | 90.0% | 64.8% | $17M | -$8M | -$15M | |

|
1995 | 35.7 | 25.3% | 47.3% | $7M | -$8M | -$15M | |

|
2011 | 69.5 | 71.3% | 79.4% | $40M | -$11M | -$15M | |

|
2013 | 88.8 | 95.2% | 98.1% | $493M | -$17M | -$16M | |

|
1998 | 69.7 | 78.1% | 76.2% | $29M | -$9M | -$16M | |

|
2018 | 54.4 | 43.0% | 75.3% | $13M | -$12M | -$16M | |
| 2019 | 90.7 | 94.0% | 97.6% | $433M | -$17M | -$16M | ||

|
2009 | 59.4 | 61.7% | 61.4% | $6M | -$11M | -$16M | |
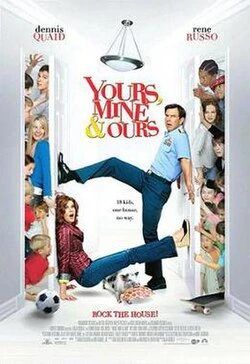
|
2005 | 75.6 | 85.7% | 86.4% | $73M | -$11M | -$16M | |

|
2009 | 42.4 | 37.7% | 26.1% | $90K | -$11M | -$16M | |

|
2010 | 62.5 | 60.8% | 80.4% | $51M | -$12M | -$16M | |

|
2018 | 48.2 | 23.0% | 64.7% | $4M | -$13M | -$17M | |

|
2007 | 39.1 | 33.7% | 49.0% | $1M | -$11M | -$17M | |

|
2013 | 57.5 | 45.2% | 79.1% | $27M | -$13M | -$17M | |

|
2005 | 91.3 | 96.0% | 92.2% | $117M | -$11M | -$17M | |
|
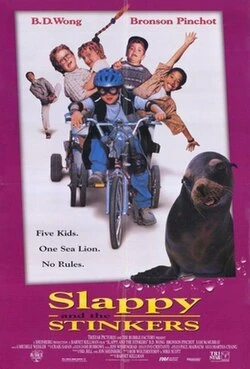
1998 | 20.8 | 10.4% | 13.7% | $81K | -$9M | -$17M | |
|
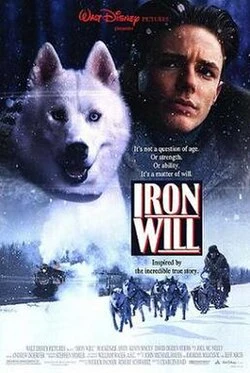
1994 | 65.5 | 59.5% | 72.8% | $21M | -$8M | -$18M | |

|
2015 | 24.4 | 8.5% | 34.1% | $144K | -$13M | -$18M | |

|
2017 | 78.4 | 79.4% | 93.3% | $197M | -$15M | -$18M | |

|
2008 | 64.1 | 64.9% | 69.7% | $13M | -$12M | -$18M | |

|
2011 | 72.6 | 74.6% | 93.1% | $170M | -$15M | -$18M | |

|
2004 | 59.8 | 57.9% | 78.1% | $29M | -$11M | -$18M | |

|
2015 | 89.4 | 96.7% | 99.3% | $1B | -$15M | -$18M | |

|
1994 | 61.5 | 77.7% | 60.0% | $16M | -$9M | -$18M | |

|
1988 | 51.0 | 63.8% | 49.8% | $6M | -$7M | -$19M | |

|
Peter Rabbit 2: The Runaway
COVID-era
|
2021 | 77.6 | 67.1% | 93.4% | $154M | -$17M | -$19M |

|
2014 | 65.8 | 50.3% | 86.0% | $64M | -$15M | -$19M | |

|
1997 | 39.7 | 29.1% | 52.4% | $7M | -$9M | -$19M | |

|
2019 | 87.1 | 83.1% | 94.1% | $189M | -$17M | -$19M | |

|
2005 | 70.8 | 64.7% | 79.1% | $39M | -$12M | -$19M |